Swiss Franc Currency Index Last week the Swiss Franc improved against both euro and dollar, but – compared to its safe-haven counterpart Japanese Yen – it had a bad performance. We expect strong SNB interventions, that reflect the demand for CHF safe-haven. Trade-weighted index Swiss Franc, April 14(see more posts on Swiss Franc Index, ) Source: markets.ft.com - Click to enlarge Swiss Franc Currency Index (3 years) The Swiss Franc index is the trade-weighted currency performance (see the currency basket)On a three years interval, the Swiss Franc had a weak performance. The dollar index was far stronger. The dollar makes up 33% of the SNB portfolio and 25% of Swiss exports (incl. countries like China or Arab countries that use the dollar for exchanges). Contrary to popular believe, the CHF index gained only 1.73% in 2015. It lost 9.52% in 2014, when the dollar (and yuan) strongly improved. Swiss Franc Currency Index (3 years), April 14(see more posts on Swiss Franc Index, ) Source: markets.ft.com - Click to enlarge USD/CHF The US also dropped the largest non-nuclear bomb on IS bunkers in Afghanistan. At the same time, it sent an aircraft carrier group toward North Korea.
Topics:
George Dorgan considers the following as important: Australian Dollar, Bollinger Bands, British Pound, Canadian Dollar, Crude Oil, EUR-USD, EUR/CHF, Euro, Euro Dollar, Featured, FX Trends, Japanese Yen, MACDs Moving Average, Mario Draghi, newsletter, RSI Relative Strength, S&P 500 Index, S&P 500 Index, Stochastics, Swiss Franc Index, U.S. Dollar Index, U.S. Treasuries, USD/CHF, USDJPY
This could be interesting, too:
Nachrichten Ticker - www.finanzen.ch writes Die Performance der Kryptowährungen in KW 9: Das hat sich bei Bitcoin, Ether & Co. getan
Nachrichten Ticker - www.finanzen.ch writes Wer verbirgt sich hinter der Ethereum-Technologie?
Martin Hartmann writes Eine Analyse nach den Lehren von Milton Friedman
Marc Chandler writes March 2025 Monthly
Swiss Franc Currency IndexLast week the Swiss Franc improved against both euro and dollar, but – compared to its safe-haven counterpart Japanese Yen – it had a bad performance. We expect strong SNB interventions, that reflect the demand for CHF safe-haven. |
Trade-weighted index Swiss Franc, April 14(see more posts on Swiss Franc Index, )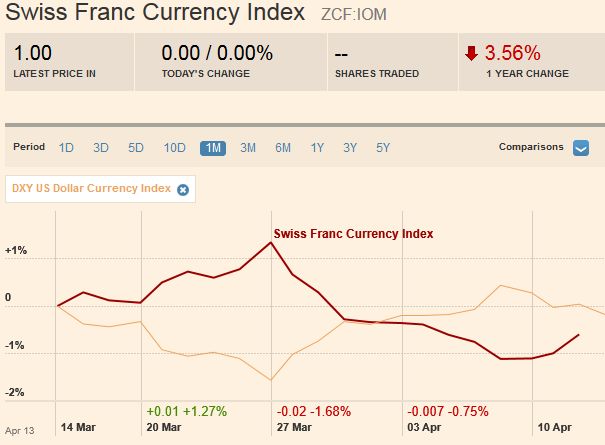 Source: markets.ft.com - Click to enlarge |
Swiss Franc Currency Index (3 years)The Swiss Franc index is the trade-weighted currency performance (see the currency basket)On a three years interval, the Swiss Franc had a weak performance. The dollar index was far stronger. The dollar makes up 33% of the SNB portfolio and 25% of Swiss exports (incl. countries like China or Arab countries that use the dollar for exchanges).
|
Swiss Franc Currency Index (3 years), April 14(see more posts on Swiss Franc Index, )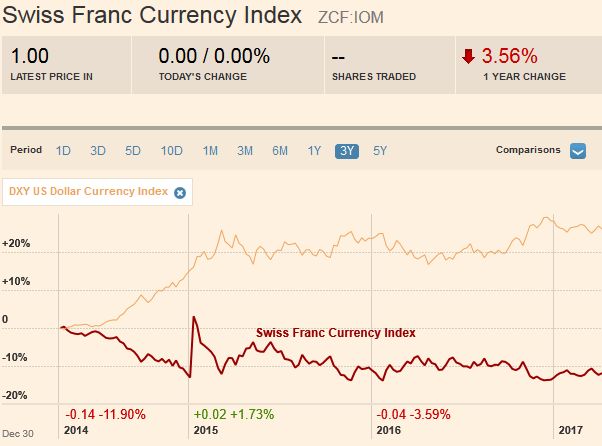 Source: markets.ft.com - Click to enlarge |
USD/CHFThe US also dropped the largest non-nuclear bomb on IS bunkers in Afghanistan. At the same time, it sent an aircraft carrier group toward North Korea. While the fear of that the Trump Administration was going to be isolationist has subsided, there is a concern about unilateralism and the seeming lack of an overarching strategy. Away from these military developments, the tightening of the French presidential election is contributing to the heightened anxiety. The latest polls show that when the margin of error is taken into account, any of the top four candidates could theoretically make it the second round. This led to a widening of the French premium over Germany. The second driver was the comments by President Trump complaining about the dollar’s strength. Both the timing and substance of his remarks caught the market off-guard. According to various measures, the US dollar has declined through the first quarter. A few weeks ago, Treasury Secretary Mnuchin signed off on a G20 statement that reiterated the longstanding position the foreign exchange market should not be weaponized. That is to say that countries ought not to seek to boost competitiveness in the foreign exchange market, but that is precisely what Trump did. Despite the strength of US exports, Trump complained that the “strong dollar” was hampering the competitiveness of US firms. |
US Dollar/Swiss Franc FX Spot Rate, April 14(see more posts on USD/CHF, )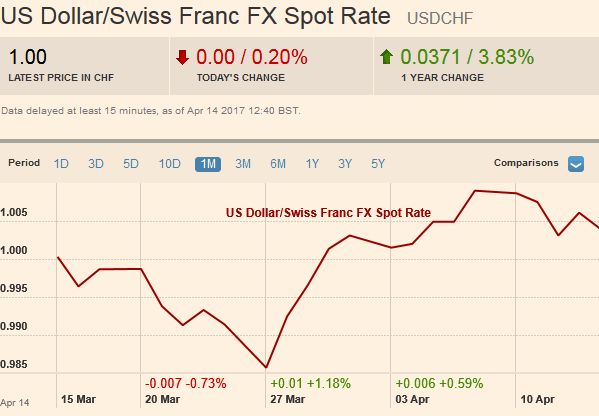 Source: markets.ft.com - Click to enlarge |
US Dollar IndexThe US dollar suffered broadly last week. It fell against the all major currencies and most of the emerging market currencies. There were two main drivers. The first was the heightened geopolitical risks. The US launched a missile strike against Syria’s government forces in retaliation for its use of chemical weapons. The Dollar Index snapped a two-week advance and shed about 0.65% last week. Further losses seem likely in the coming days, as the technical condition deteriorated. Initial support is seen in the 99.80-100.00 area, and a break, which seems probable, given the position of the technical indicators, would target the 99.00 area, where the recent leg up began and housed the 200-day moving average. The five-day moving average is looks poised to fall back below the 20-day moving average next week. A move above the downtrend line connecting the January and March highs, and approached last week would lift the tone. It is found near 101.40 at the start of the new week, falling about two ticks a day. |
US Dollar Currency Index, April 14(see more posts on U.S. Dollar Index, )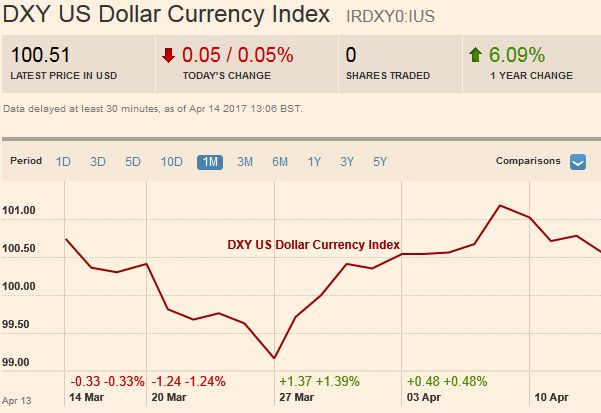 Source: markets.ft.com - Click to enlarge |
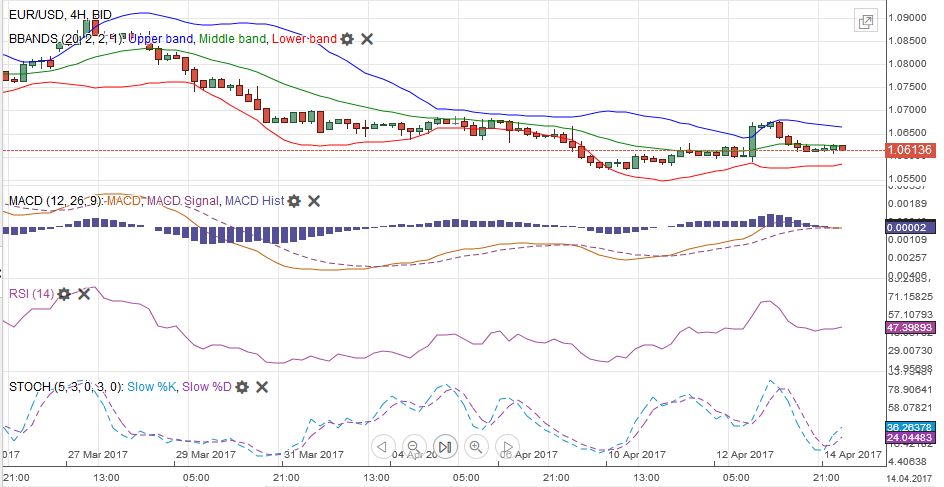
EUR/USDThe euro was among the poorest performers among the major currencies last week, gaining 0.25%. However, there was little enthusiasm to sell the euro below $1.06, where the trend line drawn off the January and March lows comes it. It is not traded above $1.07 yet in April. The Slow Stochastics have turned higher, and the MACDs also look poised to turn in the coming days. The $1.0680-$1.0700 offer initial resistance, and to be sure, cautiousness may prevail ahead of the French presidential election. Above there, potential extends toward $1.0740, and possibly $1.0780. The latter may be a bit of a stretch, but reachable if the deadlocked French polls shift back to Macron or if US yields fall further after the soft US CPI and headline retail sales before the weekend. |
EUR/USD with Technical Indicators, April 14(see more posts on Bollinger Bands, EUR / USD, MACDs Moving Average, RSI Relative Strength, Stochastics, ) |
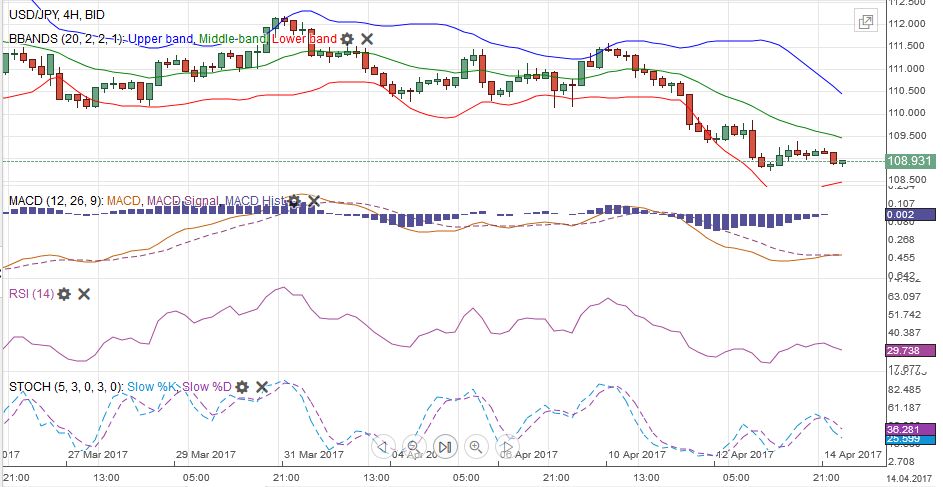
USD/JPYThe Japanese yen was the strongest currency in the world last week, gaining nearly 2.3% against the dollar. It was yen’s biggest weekly gain since last July. We argue it is an exaggeration to think of this as a safe haven characteristic of the yen. Even though foreign investors were not buyers of roughly JPY1 trillion of stocks and bonds in the week ending April 7, it was less than the previous week. And Japanese investors sold more than twice as many foreign bonds (short-covering). In the 14 weeks so far this year (through April 7), Japanese investors bought foreign bonds in five weeks. We suggest that the real safe haven was US Treasuries, where despite the holiday-shortened week, the 10-year yield tumbled 14 bp, driving yields almost 2.21%. It is the lowest yield in nearly five months. The drop in US yields, we suspect, spurred buying back of previously sold yen and discourages fresh portfolio flows out of Japan. Given Japan’s growing current account surplus, anything that detracts from capital outflows spurs yen appreciation. The dollar finished below the 200-day moving average (~JPY108.80) against the yen for the first time since the US election, which also corresponds to the lower Bollinger Band. The 61.8% retracement of the dollar’s rally since the election is found close to JPY107.85. Previous support at JPY110 now serves as resistance. |
USD/JPY with Technical Indicators, April 14(see more posts on Bollinger Bands, MACDs Moving Average, RSI Relative Strength, Stochastics, USD/JPY, ) |
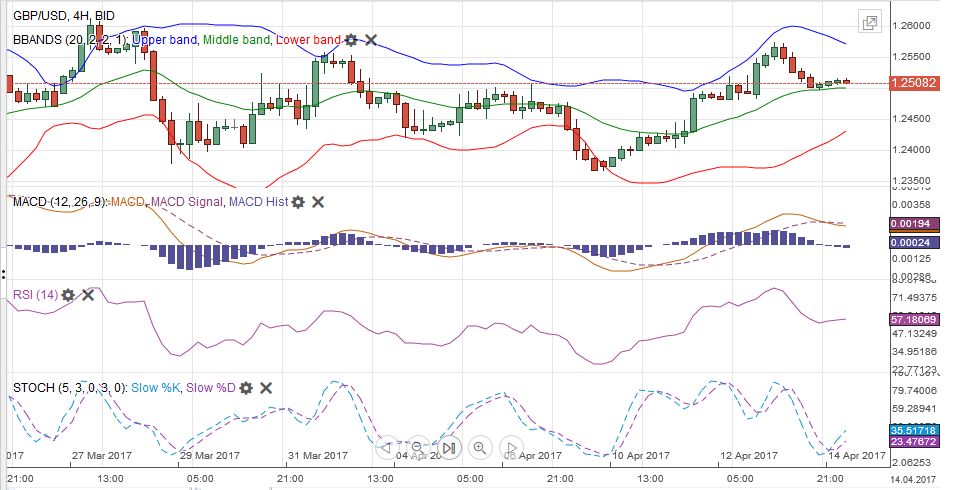
GBP/USDThe British pound was the second strongest currency among the majors. It rose about 1.25% against the greenback, and the five-day moving average moved above the 20-day. The technical indicators are not generating very clear signals, but we see initial potential toward $1.2600-$1.2620. Above there lies the year’s high set in early February a little above $1.2700. We suspect sterling may begin the week on firm footing, but anticipate a softer close, The BRC data warns of weakness in retail sales, which will be reported at the end of the week. It is likely to be the fourth decline in the past five months. |
GBP/USD with Technical Indicators, April 14(see more posts on Bollinger Bands, GBP/USD, MACDs Moving Average, RSI Relative Strength, Stochastics, ) |
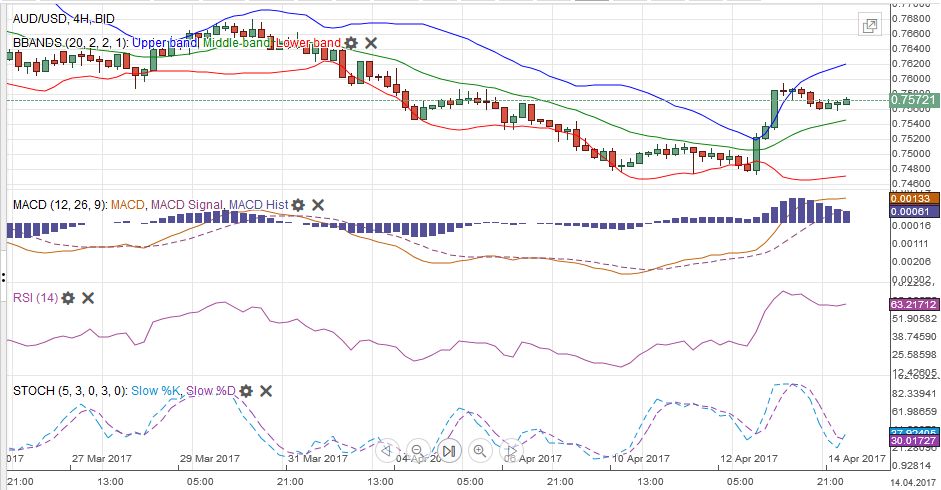
AUD/USDFor the most part, since the middle of January, the Australian dollar has traded in a range between $0.7500 and $0.7750. It had looked as if the bottom end of the range was going to give last week. Although it never closed below $0.7500, it did spend some time below there. The stronger than expected jobs data, the heavier tone to the US dollar in general, the decline in US rates, and perhaps also the strong Chinese trade figures, helped the Aussie return toward the middle of its range. The $0.7615 to $0.7650 area is likely to offer an important hurdle for the bulls. |
AUD/USD with Technical Indicators, April 14(see more posts on Australian Dollar, Bollinger Bands, MACDs Moving Average, RSI Relative Strength, Stochastics, ) |
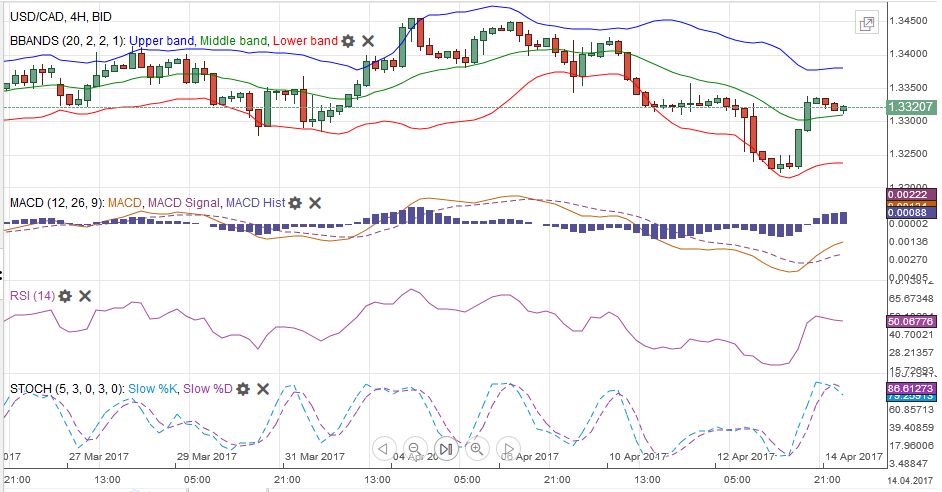
USD/CADThe US dollar was stymied by CAD1.3340 in the last three sessions. It corresponds to the 50% retracement of the decline from the April 4 high near CAD1.3455. In the last seven sessions, the US dollar has gained in only one. The 61.8% retracement is near CAD1.3365. The greenback held the 200-day moving average (~CAD1.3225) at the lows. The US two-year premium over Canada has narrowed by almost ten basis points since March 28, but it is holding a trend line drawn from last October and this past February’s lows. Our correlation work also shows that the Canadian dollar has become more sensitive to the price of oil. |
USD/CAD with Technical Indicators, April 14(see more posts on Bollinger Bands, Canadian Dollar, MACDs Moving Average, RSI Relative Strength, Stochastics, ) |
Crude OilOil closed higher for the third consecutive week, falling in only one session each week. The momentum may be slowing as the May light sweet crude oil futures contract approaches $54 a barrel. Above there lies the high set earlier this year on the continuation contract was near $55.25. Technical indicators appear to be getting toppish, warning that participants should be on the lookout for a reversal pattern to signal a corrective phase. The five-day moving average has been offering support in the run-up, and it is found near $53. |
Crude Oil, April 2016 - April 2017(see more posts on Crude Oil, )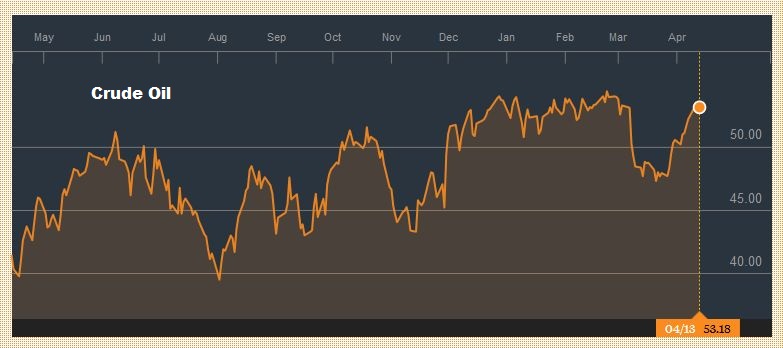 Source: bloomberg.com - Click to enlarge |
U.S. TreasuriesReturning to US Treasuries, we note that the decline in yields since the FOMC hiked rates last month has been chiefly a decline in real yields rather than in inflation expectations. The nominal yield has fallen more than 40 bp, while the 10-year breakeven eased bout 15 bp. There seems to be three hypothesis. The first is that the decline in real rates is a function of safe haven demand even though the US is at the center of the geopolitical tensions. The second is that investors’ faith in Trump to deliver on his economic promises has been shaken. Third, the divergence is exaggerated by the liquidity differences, and more a statistical quirk than a window into market psychology. The June 10-year note futures closed at the 38.2% retracement objective (126-02) of the sell-off since the US election last November. The 50% retracement is 127-00. The Slow Stochastics may be showing a bearish divergence insofar as it has not confirmed the new highs, though the RSI and MACDs allow room for additional near-term gains. The contract has fallen in one session in each of the past two weeks. It has rallied for six consecutive weeks, the longest since last June-July. We will be watching for a reversal signal. |
Yield US Treasuries 10 years, April 2016 - April 2017(see more posts on U.S. Treasuries, )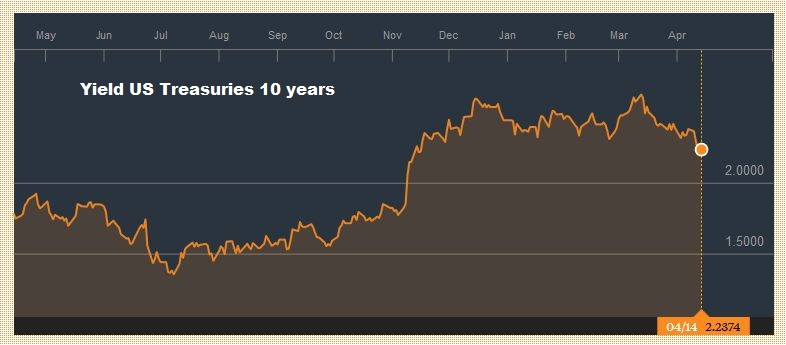 Source: bloomberg.com - Click to enlarge |
S&P 500 IndexThe S&P 500 finished the holiday-shortened week with a three-day losing streak. Technical indicators warn that additional losses are likely. Initial support is seen in the 2322-2327 range. However, if investors are reconsidering the monetary and fiscal policy mix, then the rally since the election may be subject to retracement. The 38.2% retracement is 2280, and the 50% retracement is near 2242. The trend line connecting the March 1 record high, the mid-March high, and the April 5 high is found by 2373 at the start of the week, and sloping a little less than a point a day. |
S&P 500 Index, April 14(see more posts on S&P 500 Index, )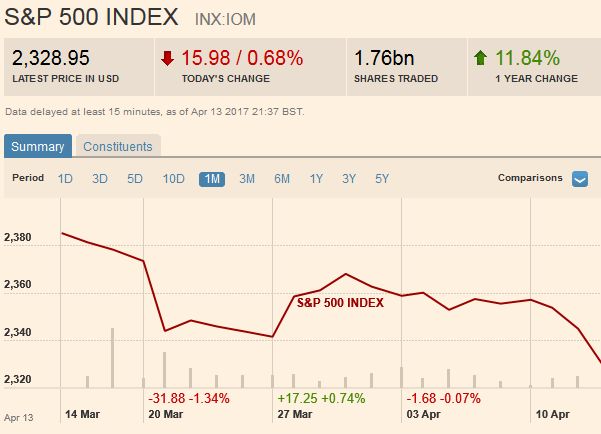 Source: markets.ft.com - Click to enlarge |
Tags: Australian Dollar,Bollinger Bands,British Pound,Canadian Dollar,Crude Oil,EUR / USD,EUR/CHF,Euro,Euro Dollar,Featured,Japanese yen,MACDs Moving Average,Mario Draghi,newsletter,RSI Relative Strength,S&P 500 Index,Stochastics,Swiss Franc Index,U.S. Dollar Index,U.S. Treasuries,USD/CHF,USD/JPY

