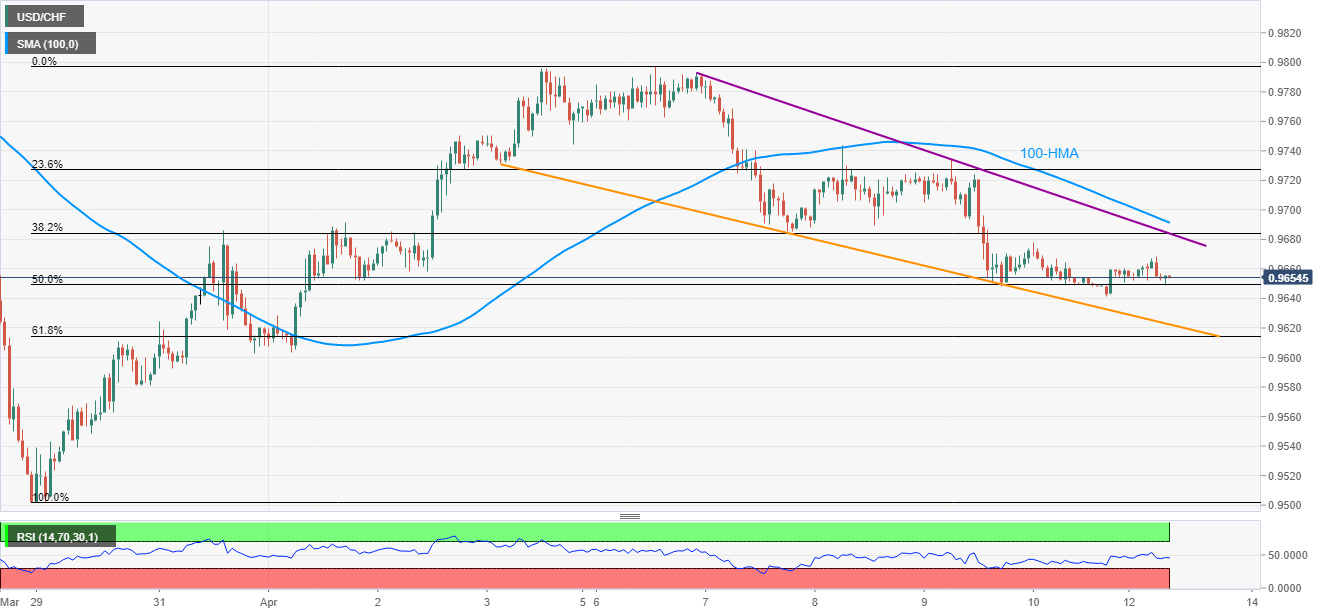
USD/CHF extends gradual declines from the monthly top marked the last-Monday. A descending trend line support, 61.8% Fibonacci retracement may offer intermediate rests during the downside. 0.9745/50 can act as a buffer resistance beyond 100-HMA. USD/CHF remains under pressure while taking rounds to 0.9655, down 0.05% on a daily, amid the early trading session on Monday. The pair currently tests 50% Fibonacci retracement of its upside from March 27 to April 06. However, a descending trend line from last-Monday, at 0.9685, followed by a 100-HMA level of 0.9693, restricts the pair’s recovery moves. Should there be a clear upside past-0.9693, the pair can cross 0.9700 mark to aim for 0.9745/50 area comprising multiple lows/highs marked during early-April. Meanwhile, a
Topics:
Anil Panchal considers the following as important: 1.) FXStreet on SNB&CHF, 1) SNB and CHF, Featured, newsletter
This could be interesting, too:
Nachrichten Ticker - www.finanzen.ch writes Die Performance der Kryptowährungen in KW 9: Das hat sich bei Bitcoin, Ether & Co. getan
Nachrichten Ticker - www.finanzen.ch writes Wer verbirgt sich hinter der Ethereum-Technologie?
Martin Hartmann writes Eine Analyse nach den Lehren von Milton Friedman
Marc Chandler writes March 2025 Monthly
- USD/CHF extends gradual declines from the monthly top marked the last-Monday.
- A descending trend line support, 61.8% Fibonacci retracement may offer intermediate rests during the downside.
- 0.9745/50 can act as a buffer resistance beyond 100-HMA.
| USD/CHF remains under pressure while taking rounds to 0.9655, down 0.05% on a daily, amid the early trading session on Monday.
The pair currently tests 50% Fibonacci retracement of its upside from March 27 to April 06. However, a descending trend line from last-Monday, at 0.9685, followed by a 100-HMA level of 0.9693, restricts the pair’s recovery moves. Should there be a clear upside past-0.9693, the pair can cross 0.9700 mark to aim for 0.9745/50 area comprising multiple lows/highs marked during early-April. Meanwhile, a downward sloping trend line from April 03, around 0.9620 now, can restrict the pair’s immediate declines ahead of 61.8% Fibonacci retracement level of 0.9615. It’s worth mentioning that the pair’s declines below 0.9615 will need validation from 0.9600 round-figure before targeting 0.9550 and March 29 low near 0.9500. |
USD/CHF hourly chart(see more posts on USD/CHF, ) |
Trend: Bearish
Tags: Featured,newsletter


