In Ian Fleming’s 1959 spy novel Goldfinger, he makes mention of the Moscow Rules. These were rules-of-thumb for clandestine agents working during the Cold War in the Soviet capital, a notoriously difficult assignment. Among the quips included in the catalog were, “everyone is potentially under opposition control” and “do not harass the opposition.” Fleming’s book added another, “Once is an accident. Twice is coincidence. Three times is an enemy action.” In economic and monetary terms, we have been living by that last one. It’s not enough to understand the repetition surrounding “reflation”, the latest (or last) being the third or fourth. There has been more to it than that. And as we move forward in what more and
Topics:
Jeffrey P. Snider considers the following as important: $CNY, 2011, bonds, China, Collateral, currencies, Dollar, economy, EuroDollar, eurodollar futures curve, Featured, Federal Reserve/Monetary Policy, ian fleming, Markets, newsletter, Oil, Panic, Repo, rising dollar, T-Bills, The United States, tic, U.S. Treasuries, WTI
This could be interesting, too:
Nachrichten Ticker - www.finanzen.ch writes Die Performance der Kryptowährungen in KW 9: Das hat sich bei Bitcoin, Ether & Co. getan
Nachrichten Ticker - www.finanzen.ch writes Wer verbirgt sich hinter der Ethereum-Technologie?
Martin Hartmann writes Eine Analyse nach den Lehren von Milton Friedman
Marc Chandler writes March 2025 Monthly
In Ian Fleming’s 1959 spy novel Goldfinger, he makes mention of the Moscow Rules. These were rules-of-thumb for clandestine agents working during the Cold War in the Soviet capital, a notoriously difficult assignment. Among the quips included in the catalog were, “everyone is potentially under opposition control” and “do not harass the opposition.” Fleming’s book added another, “Once is an accident. Twice is coincidence. Three times is an enemy action.”
In economic and monetary terms, we have been living by that last one. It’s not enough to understand the repetition surrounding “reflation”, the latest (or last) being the third or fourth. There has been more to it than that. And as we move forward in what more and more looks like another cycle, there is every reason to suspect hidden enemy action.
The downturns associated with each of those are easy enough (unless you are Ben Bernanke, Janet Yellen, or an economist like them). It’s the pre-downturn phase that calls our attention and requires more discerning analysis.
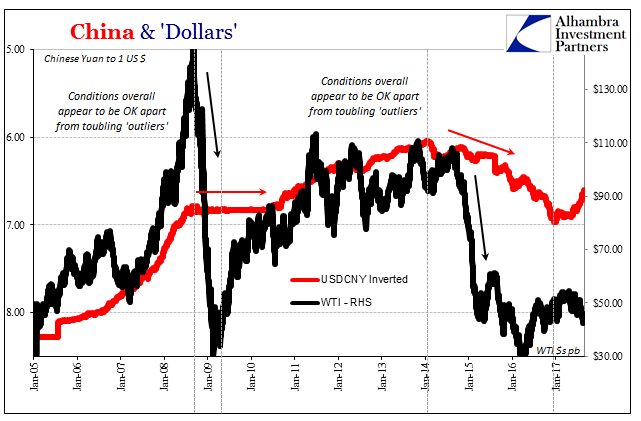
| In 2007 and even early 2008, there was no consensus about recession or subprime, let alone panic and economic collapse. That was because in the pre-collapse portion things would often look normal. This period was marked by what may have appeared to be intermittent concerns or outliers, often swiftly addressed by then-trusted central bankers. The world appeared to be still moving forward if somewhat alarmed as it did. |
China & 'Dollars', Jan 2005 - 2017 |
| You can witness the buildup of concern in any number of ways, including, as above, oil and China. Throughout 2007 and the first half of 2008, it was as if nothing much was going on at all. Everything appeared to be normal, or, as in WTI, better than. It was more than enough to cloud what should have been very clear signals of grave danger ahead.
For both WTI as well as China, the situation repeated. Omitting the 2011 crisis almost entirely, largely because of that episode’s more European rather than Asian characteristics, starting in 2013 there grew the same murkiness preceding the clear downturn at the start of 2015 (or in the closing months of 2014, depending on definitions and specific indications). |
TIC - US Banking Data, Jun 1978 - 2017 |
| The “taper drama” of that summer was a precursor to what would become the “rising dollar.” Though it seemed at the time as if that was a serious event, there was little outside of it (the economic stats, for example, universally improved) to suggest it would have lasting effects.
Those came more and more in 2014. By late 2014, however, even the stock market was caught up in it (especially October 15, which was one of those more serious outliers). |
TIC - US Banking Data, Jun 2005 - 2017 |
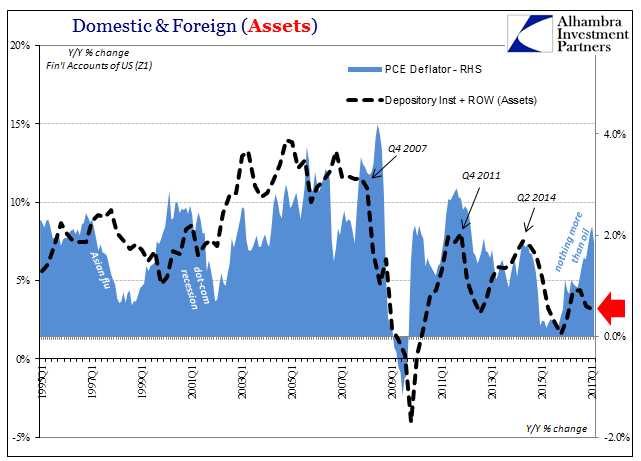
| It almost doesn’t matter which monetary indication you might choose, the pattern repeats over and over and over (and over). The downturns are never “unexpected” but instead dismissed ahead of time by ignored warnings. They start out quiet enough, but become bigger and more frequent as time passes and mainstream optimism sets in. |
Domestic & Foreign (Assets), Q1 1995 - 2017 |
| Once more in 2017, we see largely the same; lackluster growth, brief “reflation” markets, and outliers. |
Domestic & Foreign (Assets), Q1 2007 - 2017 |
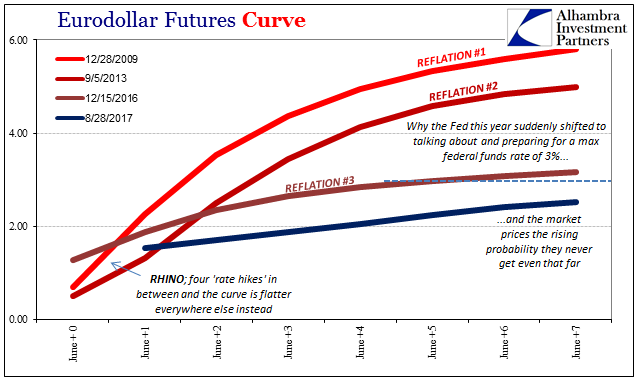
| Among those we can count the fact that this rebound or improvement phase is far less robust and resilient than any of the three before. In fact, this one is the smallest/weakest yet, a reductive cycling that importantly tells us quite a bit about how to set future expectations. None of them show much affinity for “rate hikes.” |
Eurodollar Futures Curve(see more posts on eurodollar futures curve, ) |
| Not just curves, though, but other financial and monetary indications. On that list I would also add T-bills. The magnetic attraction between bill rates and oil prices is very 2017. The 4-week’s equivalent yield hasn’t been put above the RRP “floor” since August 10 when oil prices started lower again. |
US Treasury CMT Yields, Jan - August 2017(see more posts on U.S. Treasuries, ) |
| In addition, the 3-month security has been pushed to and at times below RRP. The latest outlier in that price was just yesterday, with a 3-month bill yield of just 98 bps – despite debt ceiling concerns that grow louder and closer.
We notice and follow these kinds of “anomalies” because they aren’t supposed to happen, not in a situation where the Fed’s RRP offers what in theory is a hard floor. For bill yields to violate that floor is not random, especially not in repeated fashion. There is “something” else going on out there in the hidden reaches of the eurodollar/wholesale system. With so much that is repeated, we no longer have to guess what that might be. The enemy has been the “dollar.” It hasn’t worked for ten years, but there are times when people let themselves believe that it does or can. It really isn’t ever much more than that. |
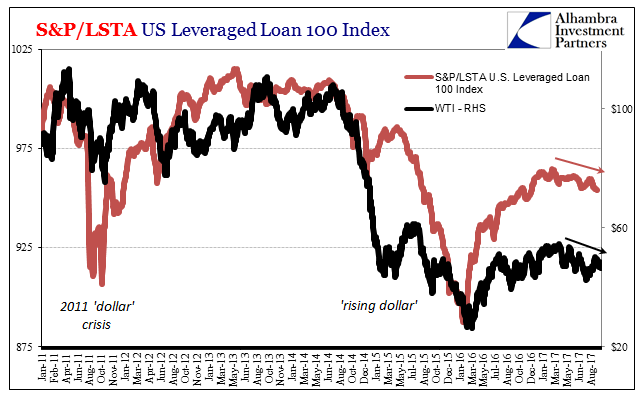
S&P/LSTA US Leveraged Loan 100 Index, Jan 2011- Aug 2017 |
Tags: $CNY,2011,Bonds,China,collateral,currencies,dollar,economy,EuroDollar,eurodollar futures curve,Featured,Federal Reserve/Monetary Policy,ian fleming,Markets,newsletter,OIL,panic,repo,rising dollar,T-Bills,tic,U.S. Treasuries,WTI


