Anil Panchal
November 25, 2019
SNB & CHF
USD/CHF pulls back from six week high.
Falling trend line since early October, 200-day SMA keeps buyers hopeful.
An upside beyond mid-October high could escalate pair’s run-up towards the previous month high.
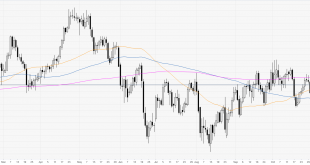
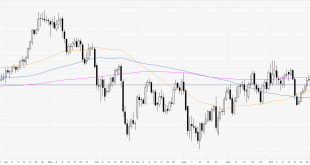
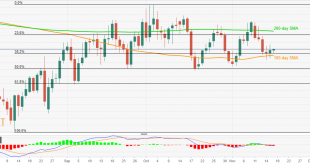
USD/CHF fails to hold the recent trend line breakout while declining to 0.9970 during early Monday.
Even so, the quote stays beyond a multi-week-old falling support-line, at 0.9960, while also trading above 200-day Simple Moving Average (SMA) level of 0.9948.
As...
Read More »
Anil Panchal
November 22, 2019
SNB & CHF
Following its latest recovery, USD/CHF rises to the highest since the previous Tuesday.
200-day SMA and multi-week-old resistance line hold the key to pair’s run-up towards 1.0000 mark.
0.9870 can entertain short-term sellers.
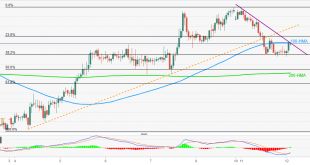
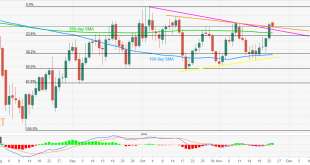
Based on its U-turn from 0.9870, the USD/CHF pair current takes the bids to the highest in eight-day while trading around 0.9940 during early Friday.
However, 200-day Simple Moving Average (SMA) and a downward sloping trend line since...
Read More »
Anil Panchal
November 21, 2019
SNB & CHF
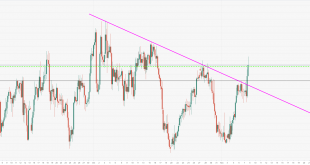
USD/CHF fails to extend uptick beyond 200-bar SMA, 50% Fibonacci retracement.
The symmetrical triangle continues to favor sideways momentum.
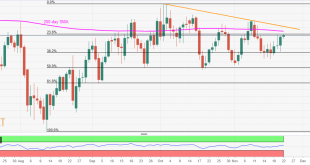
While failure to break 200-bar SMA and 50% Fibonacci retracement speaks loudly of the USD/CHF pair’s weakness, a month-old symmetrical triangle could restrict pair’s near-term moves. The quote takes the rounds to 0.9910 by the press time of the pre-European session on Thursday.
Given the quote’s latest slip beneath key technical...
Read More »
Anil Panchal
November 18, 2019
SNB & CHF
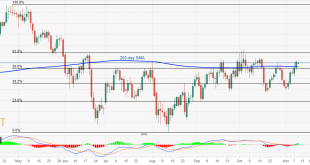
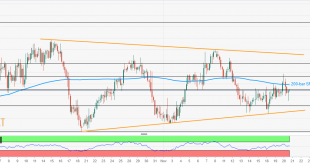
USD/CHF takes another U-turn from 100-day SMA, takes the bids above 38.2% Fibonacci retracement.
61.8% Fibonacci retracement acts as the key support while 200-day SMA holds the pair’s recovery confined.
Following its bounce off 100-day SMA, USD/CHF rises past-38.2% Fibonacci retracement of August-October upside while taking the bids to 0.9900 by the press time ahead of the European session on Monday.
Considering the pair’s recent recovery from near-term strong...
Read More »
Haresh Menghani
November 15, 2019
SNB & CHF
Renewed US-China trade optimism helped regain some traction.
The uptick lacked bullish conviction and warrants some caution.
The USD/CHF pair stalled its recent pullback from levels beyond 200-day SMA and regained some traction on the last trading day of the week. Renewed trade optimism weighed on the Swiss franc’s safe-haven status and led to a modest recovery, though bulls struggled to extend the momentum beyond the 0.9900 handle.
On the daily chart, the pair has...
Read More »
Flavio Tosti
November 13, 2019
SNB & CHF
USD/CHF erased its intraday gains, settling near the 0.9930 level.
Support is seen at the 0.9920 level.
USD/CHF daily chart
On the daily chart, USD/CHF is trading in a range below its 200-day simple moving average (DMA). The spot is holding just above the 50 SMA today at the 0.9921 level.
USD/CHF daily chart(see more posts on USD/CHF, ) - Click to enlarge
USD/CHF four-hour chart
USD/CHF is retracing down from the current November highs while challenging the...
Read More »
Anil Panchal
November 12, 2019
SNB & CHF
The USD/CHF pair’s recent recovery confronts 100-HMA, adjacent resistance line.
38.2% Fibonacci retracement, 0.9900 act as nearby supports.
Following its bounce off 38.2% Fibonacci retracement of the current month upside, USD/CHF confronts near-term key resistance confluence while taking the bids to 0.9942 during early Tuesday.
However, a sustained break of 0.9945 becomes necessary for the quote to extend recent recovery towards the support-turned-resistance line of...
Read More »
Anil Panchal
November 11, 2019
SNB & CHF
USD/CHF fails to cross mid-October high, 61.8% Fibonacci retracement.
A downside break of 0.9948 could recall 0.9900 on the chart
Bullish MACD keeps buyers hopeful.
The USD/CHF pair’s failure to rise beyond mid-October highs can’t be considered as it’s weakness unless the quote traders above 200-day SMA, 50% Fibonacci retracement of April-August downpour. The prices seesaw around 0.9970 during early Monday.
Also favoring the buyers are the bullish signals from 12-bar...
Read More »
Matías Salord
November 8, 2019
SNB & CHF
Swiss Franc amid the worst performers on Thursday amid positive trade headlines.
US dollar rises supported by higher US yields; Wall Street hits a new record.
The USD/CHF pair broke to the upside after trading sideways around 0.9925 for hours. It climbed to 0.9975, reaching a three-week high. Near the end of the session, it is consolidating gains, holding above relevant short-term technical levels.
Equity prices are higher in Wall Street amid reports that the US and...
Read More »
Flavio Tosti
November 7, 2019
SNB & CHF
USD/CHF is trading flat on the day, consolidating the gains of the last two days.
The level to beat for bulls is the 0.9940/0.9956 resistance zone.
USD/CHF daily chart
On the daily chart, USD/CHF is trading in a range below its 200-day simple moving average (DMA). The market is holding just above the 50 SMA today at the 0.9916 level.
USD/CHF daily chart(see more posts on USD/CHF, ) - Click to enlarge
USD/CHF four-hour chart
USD/CHF is trading near the monthly...
Read More »
 Swiss Economicblogs.org
-637094243479377368-310x165.png)