USD/CHF is trading up for the third consecutive day.
The level to beat for bulls is the 0.9700 resistance.
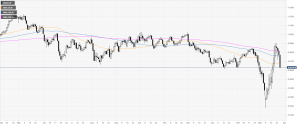
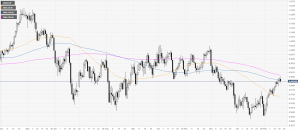
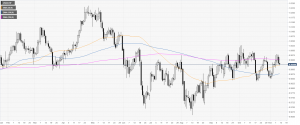
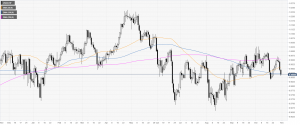
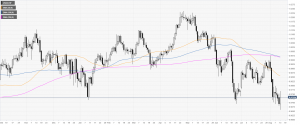
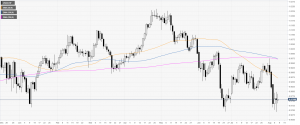
USD/CHF daily chart
USD/CHF is rebounding from the 0.9500 level while challenging the 50 SMA on the daily chart. DXY (US dollar index) is gaining some ground vs. most of its rivals.
USD/CHF daily chart(see more posts on USD/CHF, ) – Click to enlarge
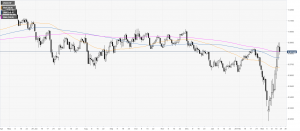
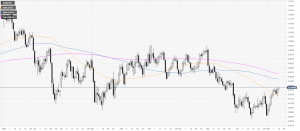
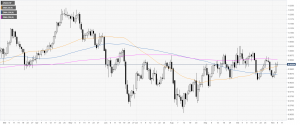
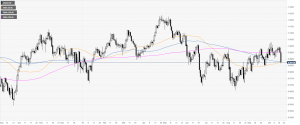
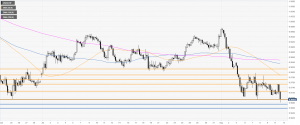
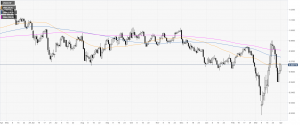
USD/CHF four-hour chart
The spot is about to challenge the 0.9700 figure while trading above the 100/200 SMAs on the four-hour chart. A break beyond the above-mentioned level would be necessary for bulls to extend the current bull move towards the 0.9800 and 0.9900 price levels on the way up. Support can emerge near the 0.9600, 0.9550 and 0.9500 price levels on any retracement.
USD/CHF four-hour chart(see
Read More »