USD/CHF is trading flat on the day, consolidating the gains of the last two days. The level to beat for bulls is the 0.9940/0.9956 resistance zone. USD/CHF daily chart On the daily chart, USD/CHF is trading in a range below its 200-day simple moving average (DMA). The market is holding just above the 50 SMA today at the 0.9916 level. USD/CHF daily chart(see more posts on USD/CHF, ) - Click to enlarge USD/CHF four-hour chart USD/CHF is trading near the monthly highs while above its main SMAs, suggesting a bullish bias in the medium term. Buyers will need to overcome the 0.9940/0.9956 resistance zone and the descending trendline. Further up, 0.9988 resistance awaits, according to the Technical Confluences Indicator. USD/CHF four-hour chart(see more posts on
Topics:
Flavio Tosti considers the following as important: 1.) FXStreet on SNB&CHF, 1) SNB and CHF, Featured, newsletter, USD/CHF
This could be interesting, too:
Nachrichten Ticker - www.finanzen.ch writes Die Performance der Kryptowährungen in KW 9: Das hat sich bei Bitcoin, Ether & Co. getan
Nachrichten Ticker - www.finanzen.ch writes Wer verbirgt sich hinter der Ethereum-Technologie?
Martin Hartmann writes Eine Analyse nach den Lehren von Milton Friedman
Marc Chandler writes March 2025 Monthly
USD/CHF daily chartOn the daily chart, USD/CHF is trading in a range below its 200-day simple moving average (DMA). The market is holding just above the 50 SMA today at the 0.9916 level. |
USD/CHF daily chart(see more posts on USD/CHF, )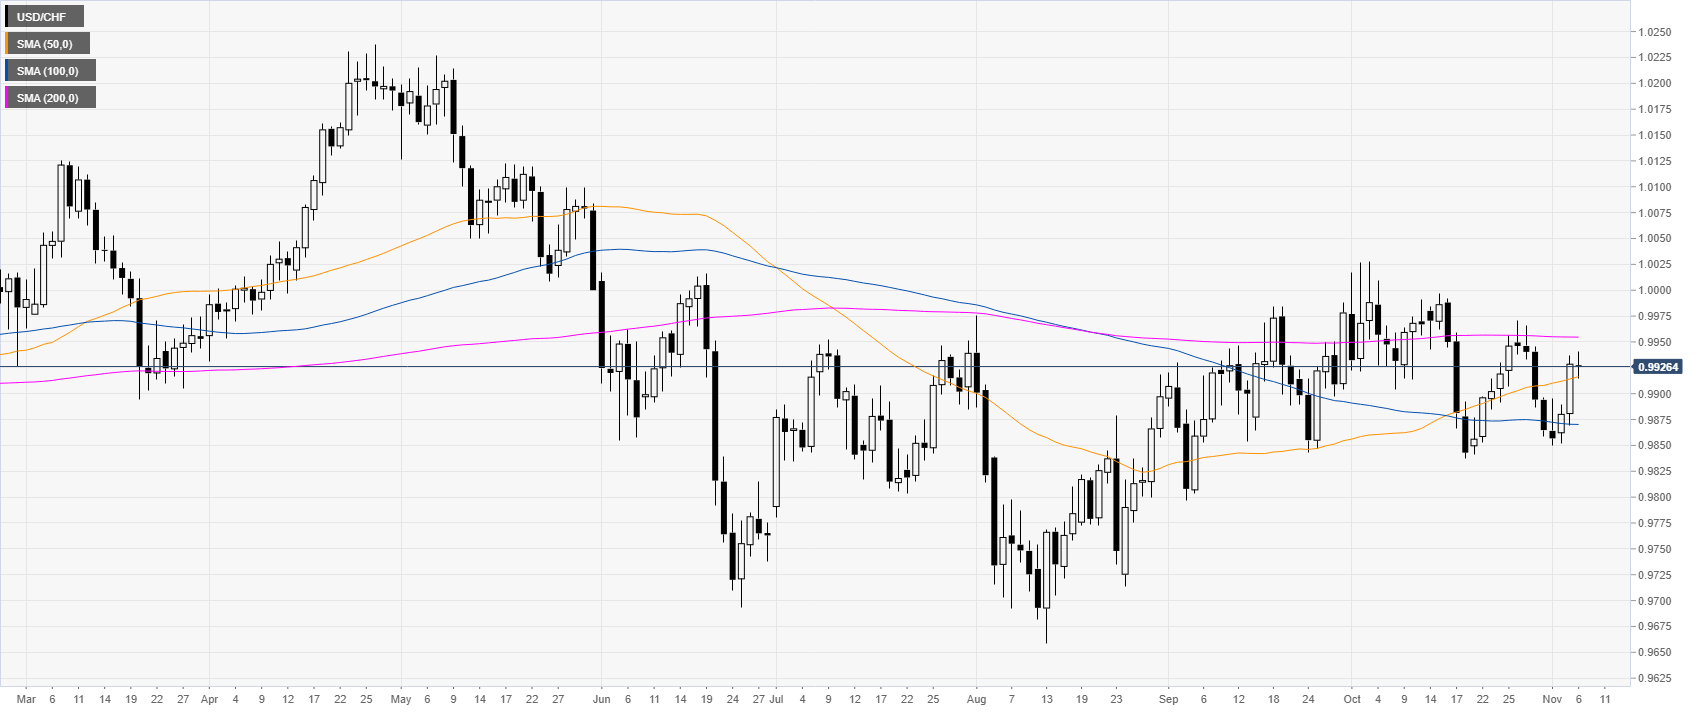 - Click to enlarge |
USD/CHF four-hour chartUSD/CHF is trading near the monthly highs while above its main SMAs, suggesting a bullish bias in the medium term. Buyers will need to overcome the 0.9940/0.9956 resistance zone and the descending trendline. Further up, 0.9988 resistance awaits, according to the Technical Confluences Indicator. |
USD/CHF four-hour chart(see more posts on USD/CHF, ) - Click to enlarge |
USD/CHF 30-minute chartUSD/CHF is trading above upward sloping 100/200 SMAs, suggesting a bullish bias in the medium term. Pullbacks down could find support near 0.9910, 0.9889 and 0.9853, according to the Technical Confluences Indicator. |
USD/CHF 30-minute chart(see more posts on USD/CHF, )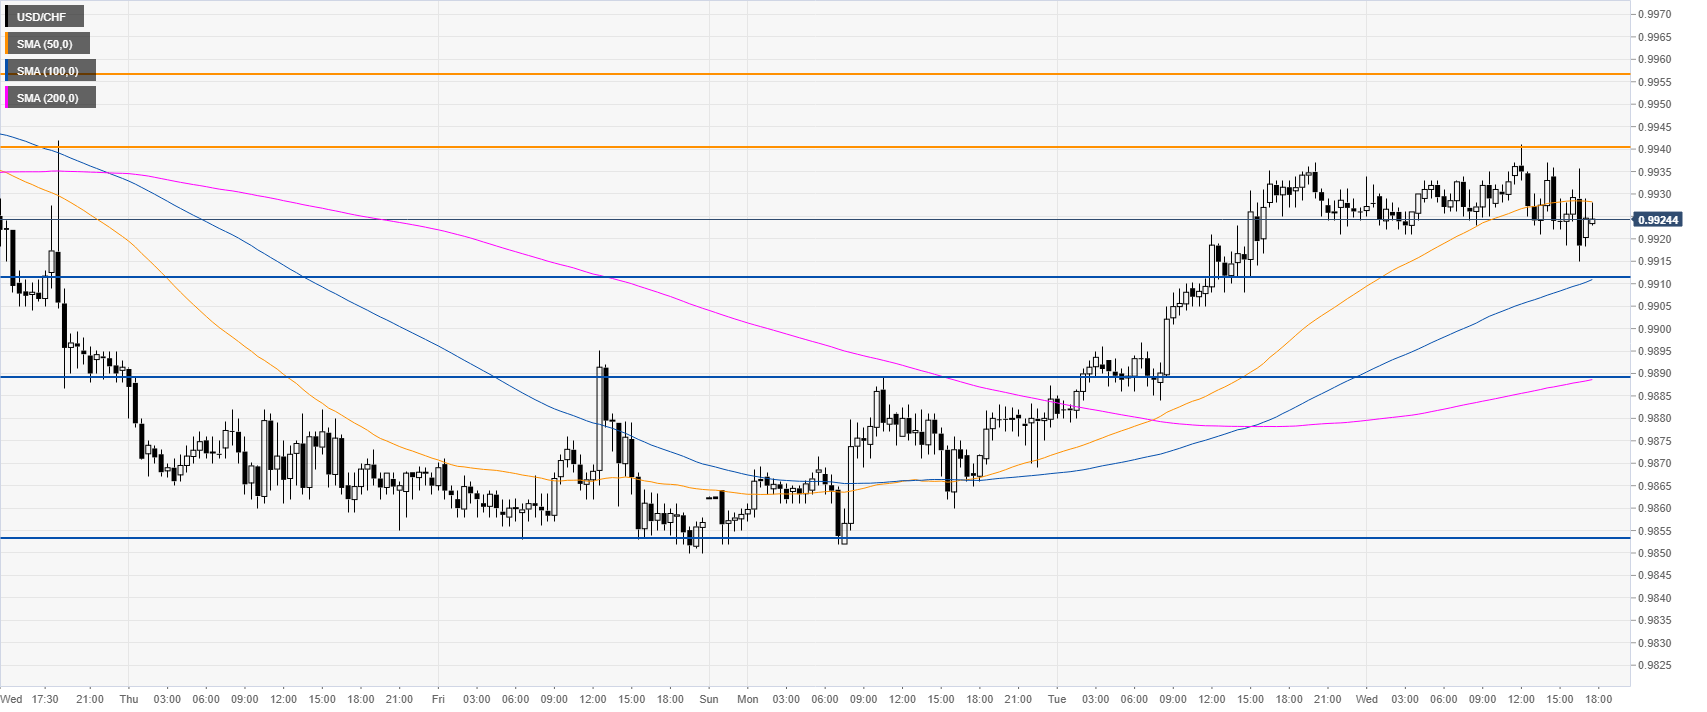 - Click to enlarge |
Tags: Featured,newsletter,USD/CHF