Anil Panchal
February 25, 2020
SNB & CHF
USD/CHF snaps two-day losing streak.
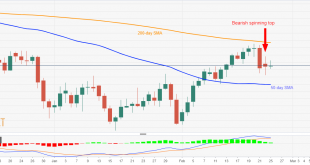
Bearish candlestick formation, sustained trading below 200-day SMA favor further selling.
Bullish MACD, 50-day SMA question the bears.
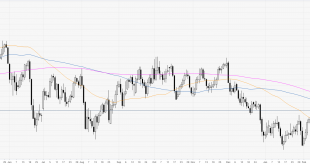
USD/CHF registers fewer moves while trading around 0.9790 during the pre-European session on Tuesday. The daily chart forms a bearish candlestick pattern but bullish MACD and 50-day SMA could limit further declines.
That said, the bears will be more powerful to aim for 0.9700 if breaking a 50-day...
Read More »
Anil Panchal
February 24, 2020
SNB & CHF
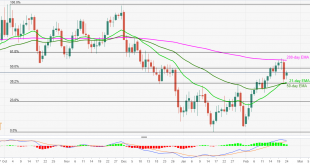
USD/CHF bounces off the short-term key support confluence comprising 21 and 50-day EMA as well as 38.2% Fibonacci retracement.
200-day EMA, 61.8% Fibonacci challenge buyers amid bullish MACD.
USD/CHF registers 0.21% gains while taking the bids around 0.9805 during the early Monday. The pair recently reversed from 21/50-day EMA and 38.2% Fibonacci retracement of October 2019 to January 2020 declines. Also supporting the pullback are bullish signals from MACD.
That...
Read More »
Flavio Tosti
February 20, 2020
SNB & CHF
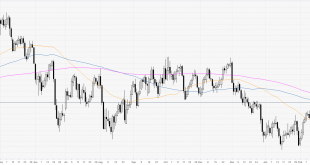
USD/CHF prints another 2020 high and retraces down in the New York session.
Bears are challenging the 0.9830 level.
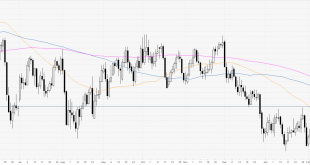
USD/CHF daily chart
After hitting yet again a new 2020 high, USD/CHF is easing from session highs. The spot is trading below the 200-day simple moving averages suggesting an overall bearish momentum in the long term.
USD/CHF daily chart(see more posts on USD/CHF, ) - Click to enlarge
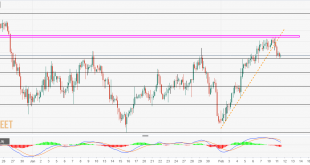
USD/CHF four-hour chart
Dollar/Swiss is trading in a rising...
Read More »
Anil Panchal
February 19, 2020
SNB & CHF
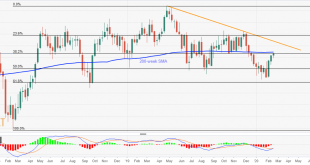
USD/CHF registers three-week winning streak, breaks above 38.2% Fibonacci retracement for the first time in a year.
61.8% Fibonacci retracement, September 2018 low act as the key supports.
USD/CHF takes the bids to 0.9835 amid the pre-European session on Wednesday. In doing so, the pair crosses 38.2% Fibonacci retracement of its broad run-up between February 2018 and April 2019. Also supporting the pair’s upside is a first in nine weeks bullish MACD signal.
Based on...
Read More »
FX Analyst
February 15, 2020
SNB & CHF
The Swiss National Bank (SNB) has the mandate to maintain CPI inflation near 2% on a yearly basis but is currently running at just 0.2%. CHF’s strength is not welcomed by SNB, economists at Rabobank reports.
Key quotes
“The strong performance of the CHF can be associated with Switzerland’s robust fundamentals which ensure that the currency is considered by many investors to be store of value. While there have been a wide number of exogenous factors which have sparked...
Read More »
Flavio Tosti
February 14, 2020
SNB & CHF
USD/CHF is slowly advancing printing fresh 2020 highs by a few pips.
The rising wedge formations can limit the upside on USD/CHF.
USD/CHF daily chart
USD/CHF is printing new 2020 highs while the quote is trading below the 100/200-day simple moving averages suggesting an overall bearish momentum.
USD/CHF daily chart(see more posts on USD/CHF, ) - Click to enlarge
USD/CHF four-hour chart
After USD/CHF broke below the rising wedge pattern the market made a retest...
Read More »
Anil Panchal
February 13, 2020
SNB & CHF
USD/CHF stalls the previous day’s declines after breaking the weekly support line (now resistance).
Late-December lows limit immediate upside, 50% Fibonacci can check the declines.
Bearish MACD favors further weakness in the quote.
USD/CHF clings to 0.9755 during the pre-European session on Wednesday. The pair snapped six-day winning streak on the break of an ascending trendline since February 03. However, 61.8% Fibonacci retracement of December 24-January 16 fall...
Read More »
Flavio Tosti
February 12, 2020
SNB & CHF
USD/CHF created a rising wedge pattern suggesting potential exhaustion in the medium term.
The level to beat for bears is the 0.9770 support.
USD/CHF daily chart
USD/CHF is pulling back down slightly from the 2020 highs while reintegrating Friday’s range. The spot is trading below the 100/200-day simple moving averages suggesting an overall bearish bias.
USD/CHF daily chart(see more posts on USD/CHF, ) - Click to enlarge
USD/CHF four-hour chart
USD/CHF is...
Read More »
Eren Sengezer
February 9, 2020
SNB & CHF
CHF struggles to find demand as a safe-haven on Friday.
US Dollar Index pushes higher above the 98.50 mark.
Nonfarm Payrolls in US is expected to come in at 160K in January.
The USD/CHF pair closed the last four trading days in the positive territory and continued to edge higher on Friday to touch its best level since December 27th at 0.9772. As of writing, the pair was up 0.2% on the day at 0.9763.
The sour market mood fails to help the CHF find demand as a...
Read More »
Flavio Tosti
February 8, 2020
SNB & CHF
USD/CHF created a strong bullish recovery while nearing the 2020 highs.
The level to beat for bulls is the 0.9770 resistance.
USD/CHF daily chart
USD/CHF is attempting to form a base near multi-month lows while trading below the main daily simple moving averages.
USD/CHF daily chart(see more posts on USD/CHF, ) - Click to enlarge
USD/CHF four-hour chart
The market is nearing the January highs while trading above the main SMAs. Bulls want a break above the...
Read More »
 Swiss Economicblogs.org