The missing piece so far is consumers. We’ve gotten a glimpse at how businesses are taking in the shock, both shocks, actually, in that corporations are battening down the liquidity hatches at all possible speed and excess. Not a good sign, especially as it provides some insight into why jobless claims (as the only employment data we have for beyond March) have kept up at a 2mm pace. These are second order effects. In terms of consumer spending, it’s, as always, spend versus save. Are consumers going to change their behavior, too? If the propensity to spend was one level before March, will it be at a lesser rate once the non-economic dislocation passes by? If so, that will cause and amplify further not-short run economic damage. That’s how exogenous shocks like
Topics:
Jeffrey P. Snider considers the following as important: 5.) Alhambra Investments, CARES Act, consumer spending, currencies, economy, Featured, Federal Reserve/Monetary Policy, Markets, newsletter, PCE, Personal Consumption Expenditures, Personal Income, personal savings rate, real personal consumption expenditures, real personal income excluding transfer receipts, transfer payments
This could be interesting, too:
Nachrichten Ticker - www.finanzen.ch writes Die Performance der Kryptowährungen in KW 9: Das hat sich bei Bitcoin, Ether & Co. getan
Nachrichten Ticker - www.finanzen.ch writes Wer verbirgt sich hinter der Ethereum-Technologie?
Martin Hartmann writes Eine Analyse nach den Lehren von Milton Friedman
Marc Chandler writes March 2025 Monthly
|
The missing piece so far is consumers. We’ve gotten a glimpse at how businesses are taking in the shock, both shocks, actually, in that corporations are battening down the liquidity hatches at all possible speed and excess. Not a good sign, especially as it provides some insight into why jobless claims (as the only employment data we have for beyond March) have kept up at a 2mm pace. These are second order effects. In terms of consumer spending, it’s, as always, spend versus save. Are consumers going to change their behavior, too? If the propensity to spend was one level before March, will it be at a lesser rate once the non-economic dislocation passes by? If so, that will cause and amplify further not-short run economic damage. That’s how exogenous shocks like COVID-19 become far more than the incidental damage they cause. |
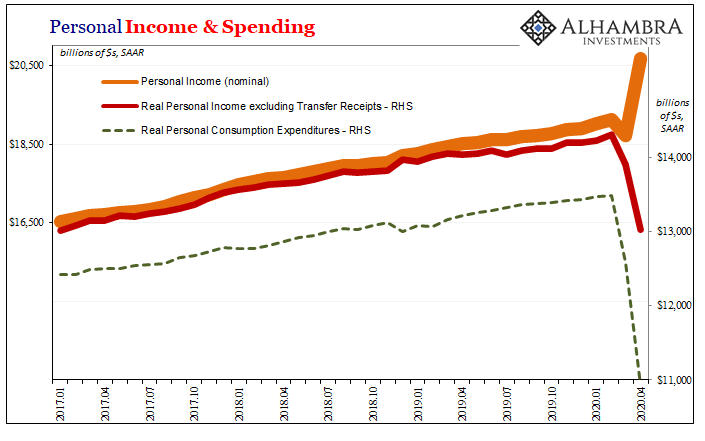
Personal Income & Spending, 2017-2020 |
| The lingering demand destruction is brought about by changes in how everyone in it behaves – if there are any.
Right now, the mainstream assumption is for the biggest and best “V”; that once the economy reopens everything will go right back to the way it was before anyone had heard of the coronavirus. Furthermore, the government’s recklessness in fiscal as well as monetary matters is being viewed as more than sufficient insurance so as to make this likely. Again, so far the business side isn’t on the government’s side (including Jay Powell). The BEA today published its April estimates for personal income and spending – the consumer end of the economy. As with everything else to this point, the first step into the crisis has been a disaster though I’ll qualify this straight away by noting we shouldn’t put too much stock into this one month of data. For one thing, April is completely out of the ordinary, a true outlier month especially for consumers if ever there was one. Second, the government’s transfer payments had just started showing up. What these figures show is that Americans were finally getting paid on their unemployment claims as well as “helicopter” money though they didn’t spend much or any of it.The difference between the surging orange line above (nominal personal income) compared to the falling red line (real income) just below it is all that “stimulus” money. And though it was pushed up by an unprecedented $2.1 trillion last month, that’s at a seasonally-adjusted annual rate. In actual dollars, the monthly level for transfer payments was far less. In fact, as you can see above, these preliminary assessments suggest spending was down way more than earned income fell. This pushed the personal savings rate to exactly one-third, or 33%; essentially meaningless. |
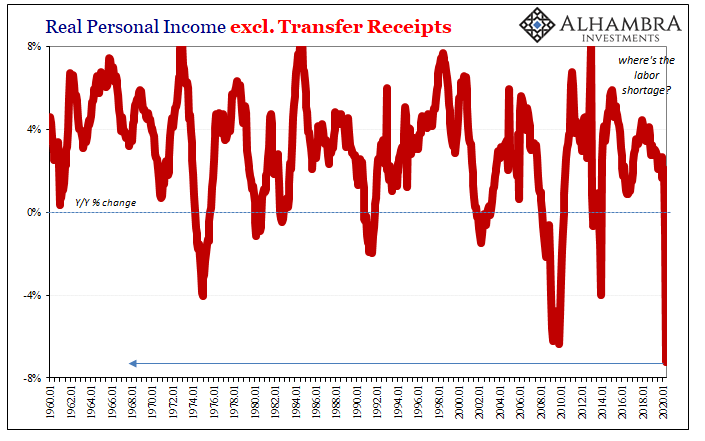
Real Personal Income, 1960-2020 |
| To put this in perspective, the 7.2% year-over-year decline in non-transfer income was the largest on record for a series that dates back sixty years. |
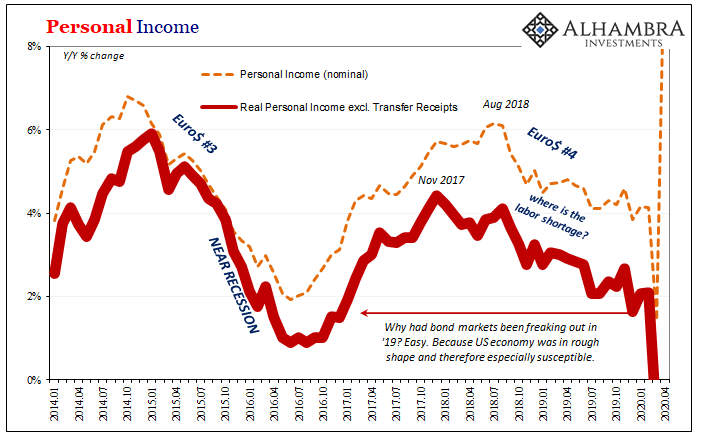
Personal Income, 2014-2020 |
| And what that series had already shown before March 2020 was a labor market being slowly squeezed by a globally synchronized downturn that had left the US economy in very susceptible shape long before the pandemic arrived. It’s been my view that this will make a difference going forward even as the reopening takes place.
These figures for April are dishearteningly consistent with this position, though, again, there’s no hard conclusions yet to be drawn from just this one month.
I’m *very* much in favor of helping American workers and even doing so in this way; by all means, send out the $1,000 checks. What I’m very much against is the idea that it will do much systemic good.https://t.co/9WEsjK8H96— Jeffrey P. Snider (@JeffSnider_AIP) March 17, 2020 |
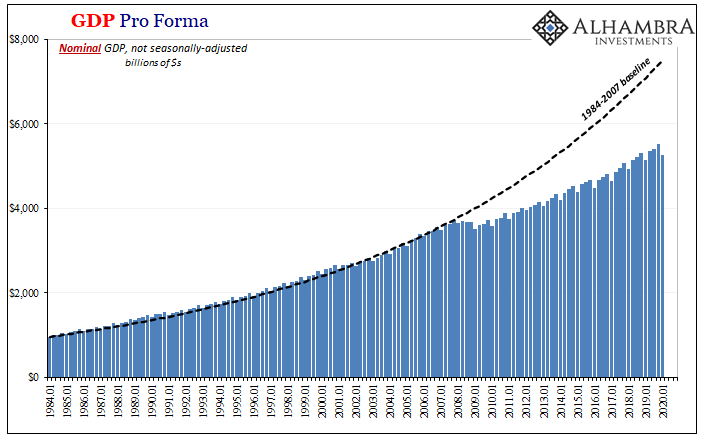
GDP Pro Forma, 1984-2020 |
| It is possible perhaps likely that a lot of the “stimulus” money does end up being spent – if it hasn’t already been during the month of May. But then the question becomes one of lost income versus these transfer receipts. The size of the income hole compared to the government’s direct aid (it’s not stimulus) intending to redistribute money since the economy isn’t.
While we wait for more data over the coming months to confirm or deny this prospect, on just plain common-sense terms it’s hard to see how consumers (like businesses) aren’t going to be changed by what’s happened. In fact, it’s very likely why even the optimists aren’t really all the optimistic about the economy going forward. The major econometric models might be giving “stimulus” too much credit, perhaps way too much, but even then they still end up with a situation that can’t be properly called a “V.” Why?
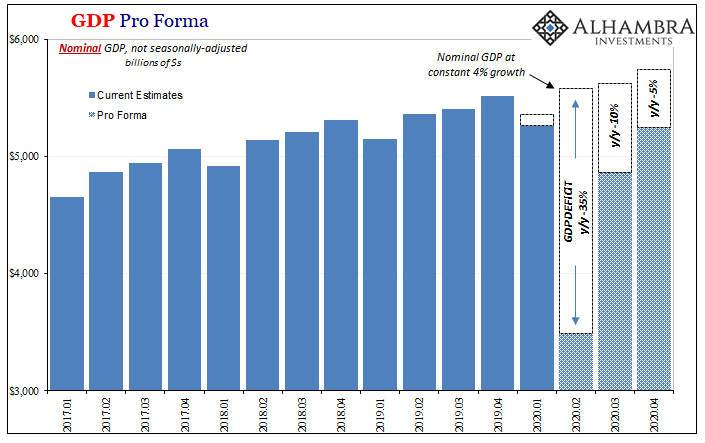
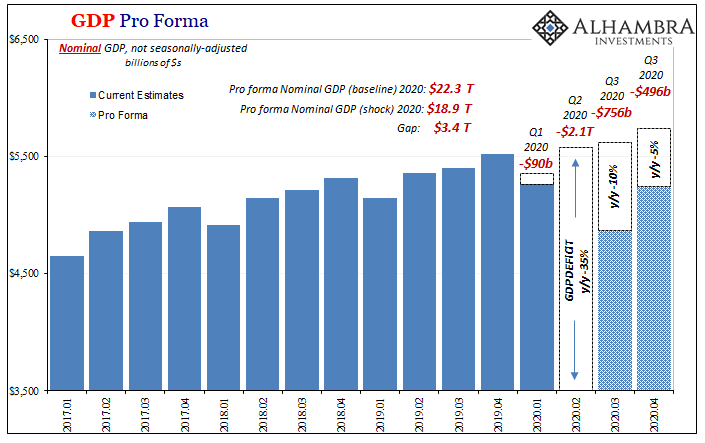
It’s not conclusive by any means, but this is more preliminary evidence that 2020 isn’t going to be different this time. “L”, in other words. My “gap” calculations (below) are so far proving to be too generous. |
GDP Pro Forma, 2017-2020 |
GDP Pro Forma, 2017-2020 |
Tags: CARES Act,consumer spending,currencies,economy,Featured,Federal Reserve/Monetary Policy,Markets,newsletter,PCE,personal consumption expenditures,Personal Income,personal savings rate,real personal consumption expenditures,real personal income excluding transfer receipts,transfer payments

