This is a companion piece to last week’s Monthly Macro report found here. The Treasury market continues to price in lower nominal and real growth. The stress, the urgency, I see in some of these markets is certainly concerning and consistent with what we have seen in the past at the onset of recession. The move in Treasuries is by some measures, as extreme as the fall of 2008 when we were in a full blown panic. That to me, is evidence that this move is overly emotional since the economic conditions today are nowhere near as severe as that time. As Jeff and I have both pointed out, the next recession is unlikely to look like the last one. The banking system, at least in the US, is in much better shape than 2008; bank failures are probably not on the next recession
Topics:
Joseph Y. Calhoun considers the following as important: 5.) Alhambra Investments, 5) Global Macro, Alhambra Research, bonds, commodities, Copper, copper to gold ratio, credit spreads, currencies, Featured, Gold, Markets, Monthly Macro Monitor, newsletter, platinum, TIPS, treasuries, US dollar, Yield Curve
This could be interesting, too:
Nachrichten Ticker - www.finanzen.ch writes Die Performance der Kryptowährungen in KW 9: Das hat sich bei Bitcoin, Ether & Co. getan
Nachrichten Ticker - www.finanzen.ch writes Wer verbirgt sich hinter der Ethereum-Technologie?
Martin Hartmann writes Eine Analyse nach den Lehren von Milton Friedman
Marc Chandler writes March 2025 Monthly
| This is a companion piece to last week’s Monthly Macro report found here.
The Treasury market continues to price in lower nominal and real growth. The stress, the urgency, I see in some of these markets is certainly concerning and consistent with what we have seen in the past at the onset of recession. The move in Treasuries is by some measures, as extreme as the fall of 2008 when we were in a full blown panic. That to me, is evidence that this move is overly emotional since the economic conditions today are nowhere near as severe as that time. As Jeff and I have both pointed out, the next recession is unlikely to look like the last one. The banking system, at least in the US, is in much better shape than 2008; bank failures are probably not on the next recession agenda. If we’re right about that the move in Treasuries might be just a tad overdone. Right now though the Treasury market sure makes things look dire. And of course, the 10/2 Treasury curve is now fully inverted, a change from when I wrote last week’s update. But we’re talking about a few basis points and this is just the initial inversion. History says we still have time – maybe quite a lot of time – before the onset of recession. So, worried but not overly so just yet. What I don’t see yet is much in the way of cross market confirmation. For instance, credit spreads have widened modestly but that is more a reflection of the extreme nature of the Treasury rally than a selloff in high yield. Indeed, HY bonds haven’t sold off at all, HYG sitting at an all time high. The copper:gold ratio shows a similar pattern due to the big rally in gold while copper has been fairly calm. The extreme move in Treasuries is concerning but keep in mind that the wisdom of crowds does not mean the market is always right. The drop in interest rates reflects a change in expectations regarding future inflation and growth but it isn’t a fait accompli. Less than a year ago the 10 year yield was at 3.25% and the consensus was that rates had no place to go but up (a consensus that didn’t include us by the way). Global synchronized growth was the wisdom of crowds – and central bankers. No one wanted long bonds right before one of the biggest and fastest rallies that market has ever seen. So, yes the moves in money and bond markets are worrisome but hardly dispositive. I don’t spend a lot of time trying to figure out the “why” of things. When we get a move like this in Treasuries, I take it at face value. It means that inflation and real growth expectations have fallen. Why that is so and why it isn’t reflected in other markets – yet? – is not something I can determine definitively. And I don’t see a lot of upside to spending my time trying to figure it out. I am often amazed at the Wall Street economists who spend so much energy speculating about causes and effects from monetary and fiscal policy. Those same economists would be happy to tell you that socialism has failed everywhere it has been tried because no one can have sufficient knowledge to guide an entire economy. All while they tell you, to the second decimal place in many cases, exactly how the latest policy change will impact growth and inflation. To use Hayek’s phrase, I maintain no such pretense of knowledge. We’d probably be a lot better off if the Fed didn’t either. |
|
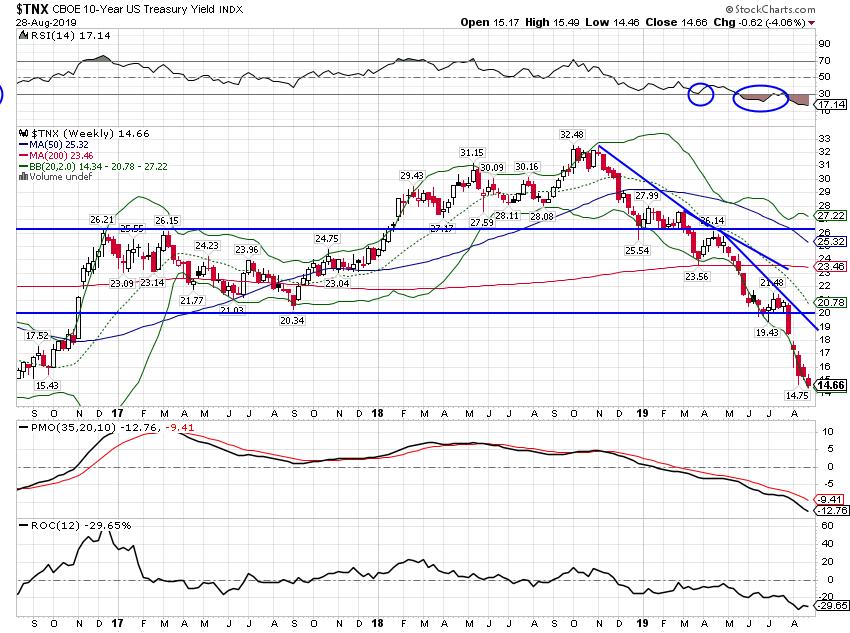
10 Year Treasury YieldWe’re going to need a bigger chart. The speed and extent of the drop in the 10 year Treasury yield is pretty stunning. |
US 10 Year Treasury Yield Index, Sep 2017 - Aug 2019(see more posts on U.S. Treasuries, ) |
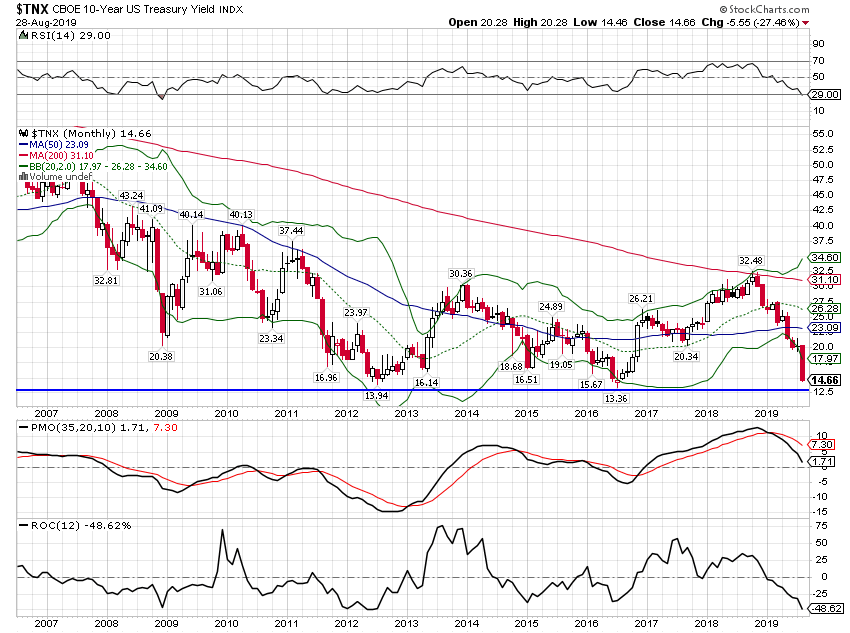
| Okay so if we zoom out a little we get some perspective. Yes rates have fallen a lot and they are very low but we’ve been here before in this cycle. A recession is certainly possible but we’ve seen three other times in just the last 7 years when rates were around these levels and we avoided it. There are no sure things in economics world. |
US 10 Year Treasury Yield Index, Monthly 2007 - 2019 |
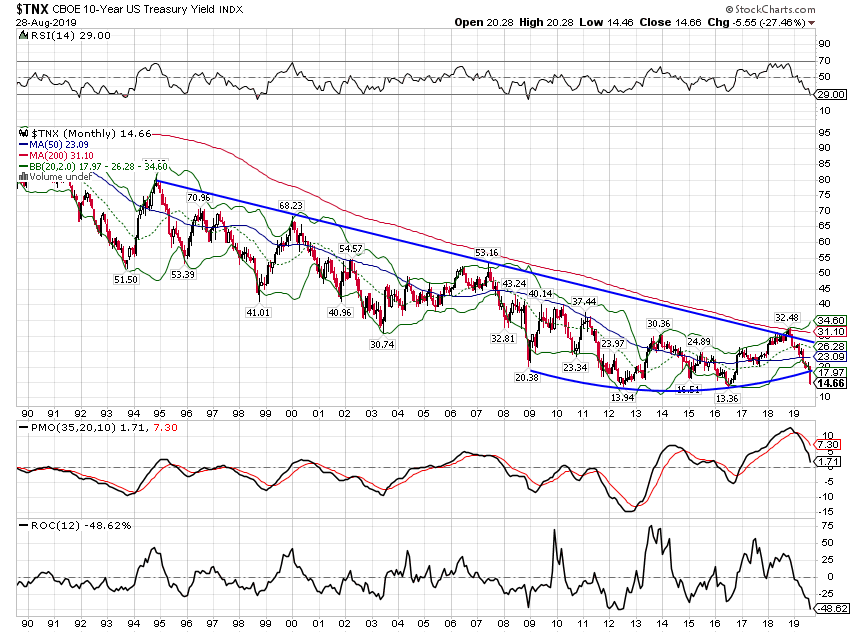
| That rounding bottom in rates I’ve been talking about for the last year? Yeah, never mind. I’d still bet we’re in the trough and the trend has changed but you’d be hard pressed to find many jumpers onto that bandwagon – which is why I think it is probably right. But this is very long term stuff and doesn’t mean much in the short term of the next couple of years. |
US 10 Year Treasury Yield Index, 1990 - 2019 |
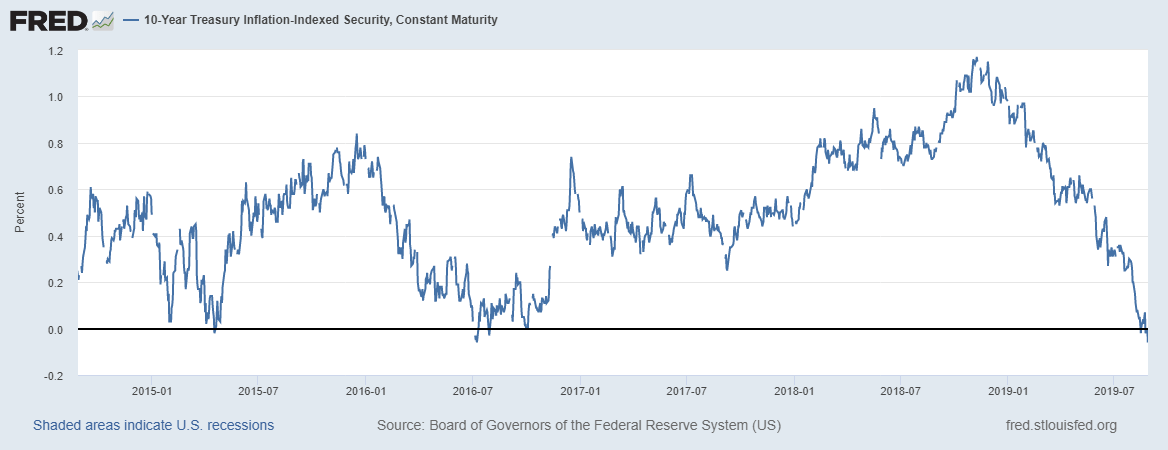
10 Year TIPS YieldsReal yields have also fallen so this isn’t just about inflation expectations. Real growth expectations as represented by 10 year TIPS yields have fallen precipitously. But a zero or small negative real rate does not mean negative real growth. As you can see, like with the 10 year nominal yield, we’ve been here before – and growth didn’t turn negative. If you want evidence of the secular stagnation though, here it is in all its glory. Real rates are the intersection of savings and investment and if real rates are low or negative, you aren’t getting much investment. |
US 10 Year Treasury Inflation, Jan 2015 - Jul 2019 |
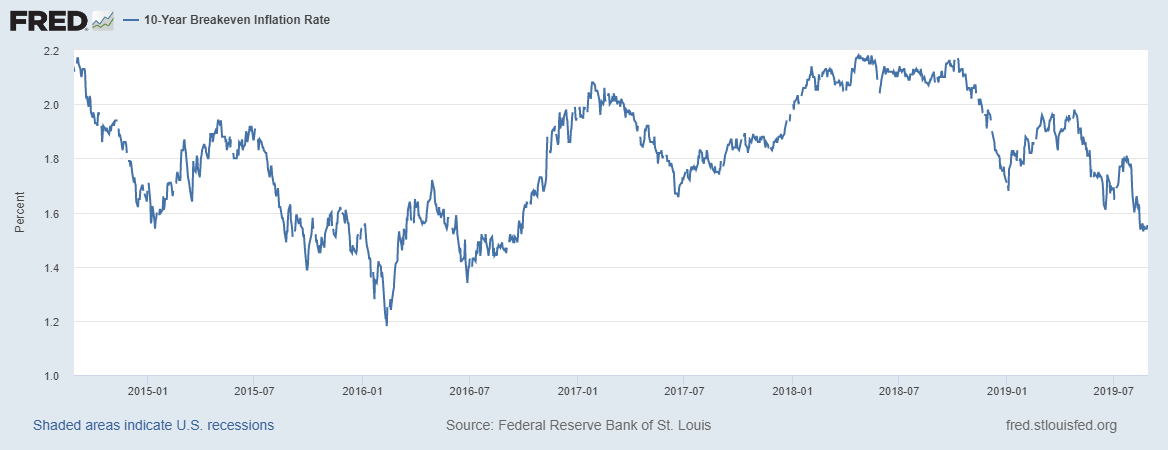
Inflation ExpectationsInflation expectations have certainly fallen but it isn’t like they have turned negative. I hear a lot of talk about deflation these days but this isn’t it, so stop it. |
US 10 Year Breakeven Inflation Rate, Jan 2015 - Jul 2019 |
2 Year Treasury Note YieldThe 2 year note yield has stabilized the last couple of weeks even as the long end has continued to rally. This is more a reflection of Fed expectations than anything else; Powell may be starting to dig his heels in a bit. Trump’s efforts to influence – nee brow beat – the Fed into more rate cuts may backfire. Former Fed Governor Bill Dudley suggested earlier this week, in a Bloomberg editorial, that the Fed should not enable Trump’s trade war by cutting rates. Part of me finds this distressing and part of me feels like it’s about time someone said this. |
US 2 Year Treasury Yield Index, February - August 2019 |
| I would not confine this sentiment to Trump though. Politicians have been avoiding hard choices for several decades while leaning on the Fed to make up the difference. Overuse of monetary policy is kind of how we got here. | |
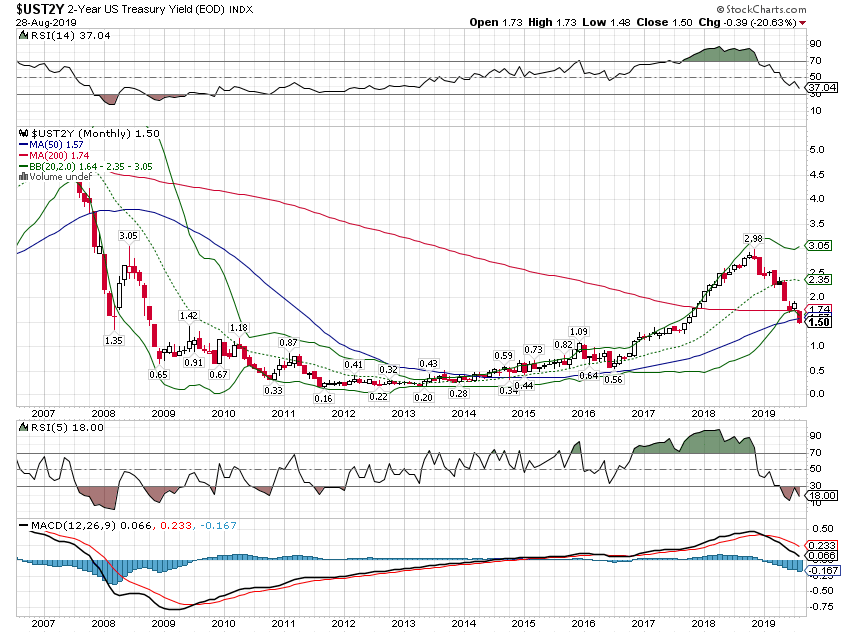
| If you zoom out a little though one might wonder if the it was the move to 3% that was the extreme. Maybe growth expectations should have never been that high to begin with. I spent all of last year telling anyone who would listen that growth would fall back to the previous trend. I also said an overshoot below trend would not be unusual. I don’t like to forecast anything but that was an easy one and here we are, right on schedule. Will it turn out to be more? I don’t know but I wouldn’t be expecting any big surges in growth anytime soon. |
US 2 Year Treasury Yield Index, Monthly 2007 - 2019 |
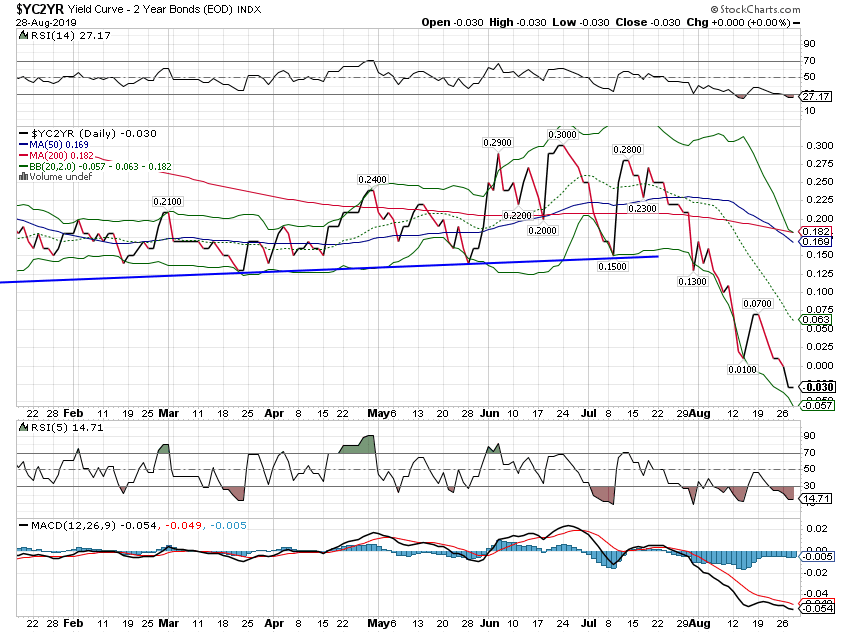
Yield CurveWith the 2 year yield stalled and the long end of the curve continuing to move lower, the yield curve flattened and then inverted. I won’t rehash what I wrote last week but I don’t think this means the same now that it did in a higher rate environment. And I would continue to caution that even if it does foreshadow recession, history says it probably isn’t imminent. |
US Yield Curve 2 Year Bonds, February - August 2019 |
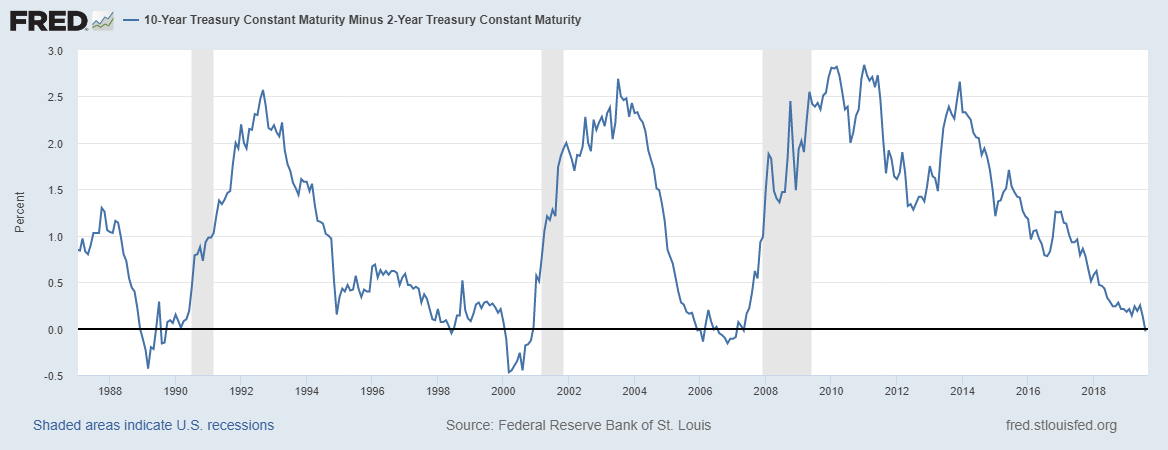
| A little context please. Yes, we’ve inverted but look at first inversions in the last three recessions. We’re generally talking lead times measured in years. |
US 10 Year Minus 2 Year Treasury Constant Maturity, 1998 - 2019 |
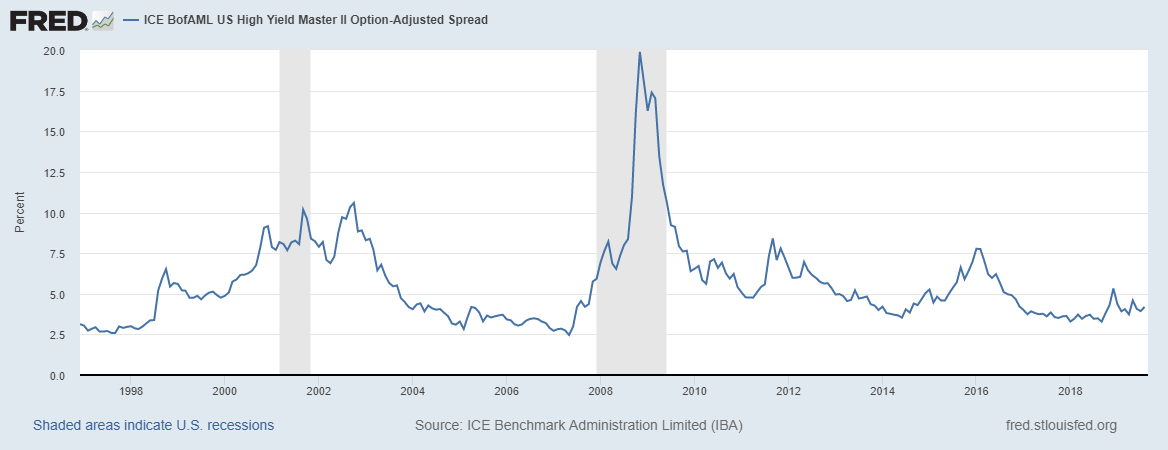
Credit SpreadsCredit spreads do not confirm the recession scenario. There is no stress in credit markets. |
US High Yield Master II Option-Adjusted Spread, 1998 - 2019 |
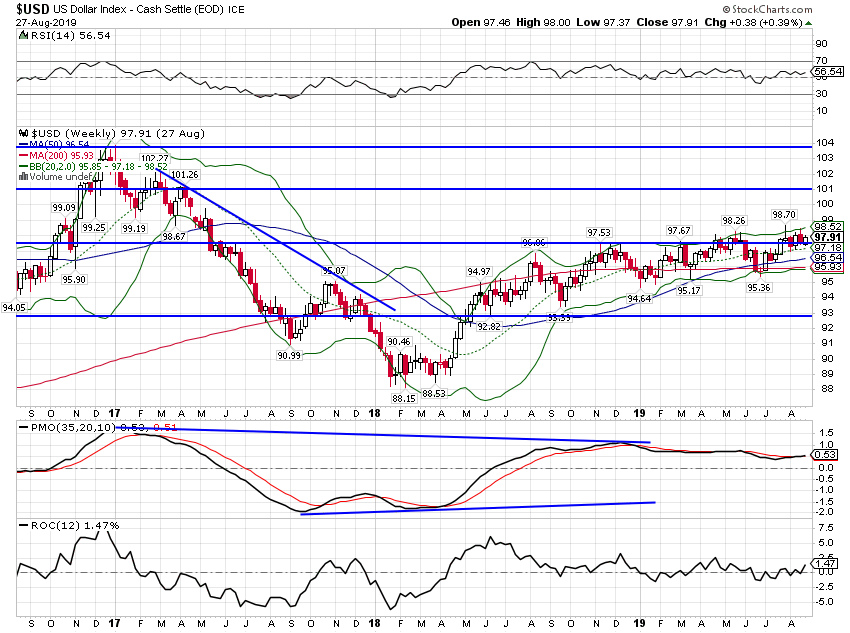
US DollarI recently read an article on Bloomberg titled “Dollar Rising Into A Possible Recession Could Be A Bad Omen“. The first sentence of the article is:
There are so many things wrong with this that I hardly know where to start but the obvious place is with the phrase “ascendant dollar” and the dollar index chart below. |
US Dollar Weekly, Sep 2017 - Aug 2019(see more posts on U.S. Dollar Index, ) |
| I thought maybe the writer meant some other dollar index – and there is more than one – but a quick look at FRED shows that the others are about as well behaved as this one. The author also seems clueless about past episodes of dollar strength and weakness. Strong dollar periods such as the 1990s are associated with high rates of investment and productivity growth. Periods of dollar weakness such as the first decade of this century are associated with the opposite. A strong dollar isn’t going to cause a recession here. I get that there are large dollar debts around the world but I’ve heard rumors of these things called futures markets where such risks can be hedged. Who knew?
Truth be told the most amazing thing about the dollar in recent years is its stability. Outside of the volatility around Trump’s election, the dollar has been remarkably stable recently and the level today is about the same as it was in 2015. With all the uncertainty and turmoil surrounding the Trump administration generally and the trade wars specifically, I find that very encouraging. And also evidence that the Fed maybe hasn’t done as bad a job as the President thinks. |
|
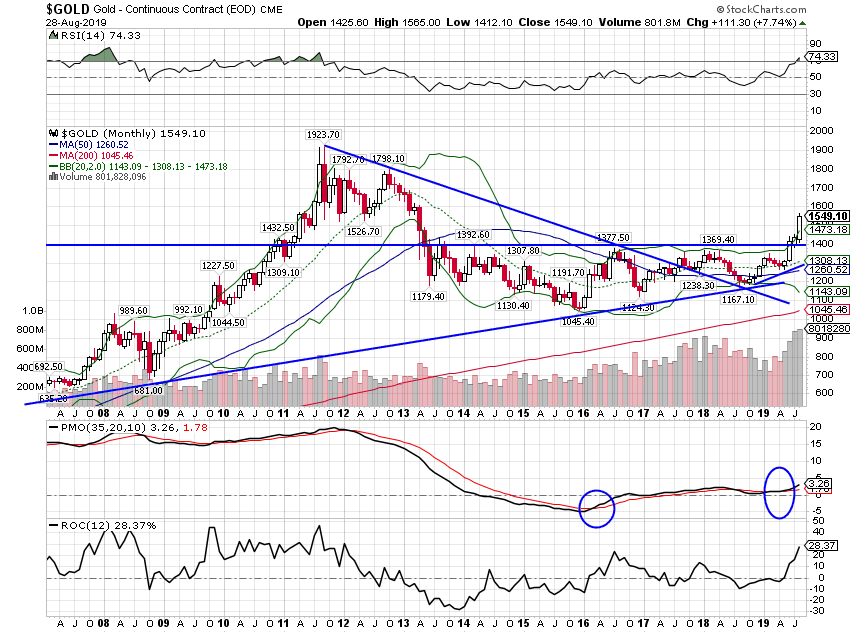
GoldHowever – and you knew there was a however didn’t you? – gold offers some evidence that the dollar hasn’t really been as stable as its course against other fiat currencies. The dollar index only measures the dollar’s relative performance against other major currencies. If they all are debased at the same rate the dollar index doesn’t move. But gold and other hard assets will. Unfortunately for all those folks pondering a strong dollar, gold shows the opposite. Of course, the price of gold in a non-gold standard world doesn’t mean the same as it once did. This is the fear trade, rising gold the flip side of falling Treasury yields. Fear of what? I can’t say for sure but Smoot-Hawley 2 rates pretty high on my list. I would point out too that in keeping with my theme that maybe things aren’t as bad as the bond and gold folks fear, there is a huge speculative long position in the gold futures market. |
Gold, February - August 2019(see more posts on Gold, ) |
| The contrarian in me wants to take a profit from gold and redeploy it in more growth oriented commodities. More on that later. | |
| From the long term view, gold has broken out above long term resistance. If this is a new bull market, pullbacks should be limited to the breakout point. |
Gold, Monthly August 2008 - 2019(see more posts on Gold, ) |
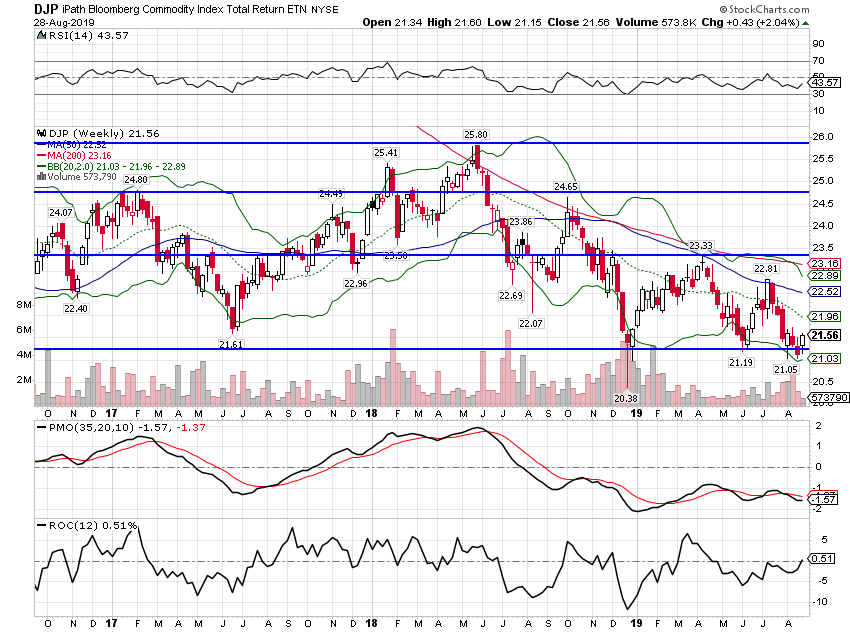
Commodity IndexesThe general commodity indexes haven’t joined gold on the upside as growth concerns have weighed. The move in gold and Treasuries though has been much more pronounced than the move in commodities. Which market is right? |
DJP, Weekly Oct 2017 - Aug 2019 |
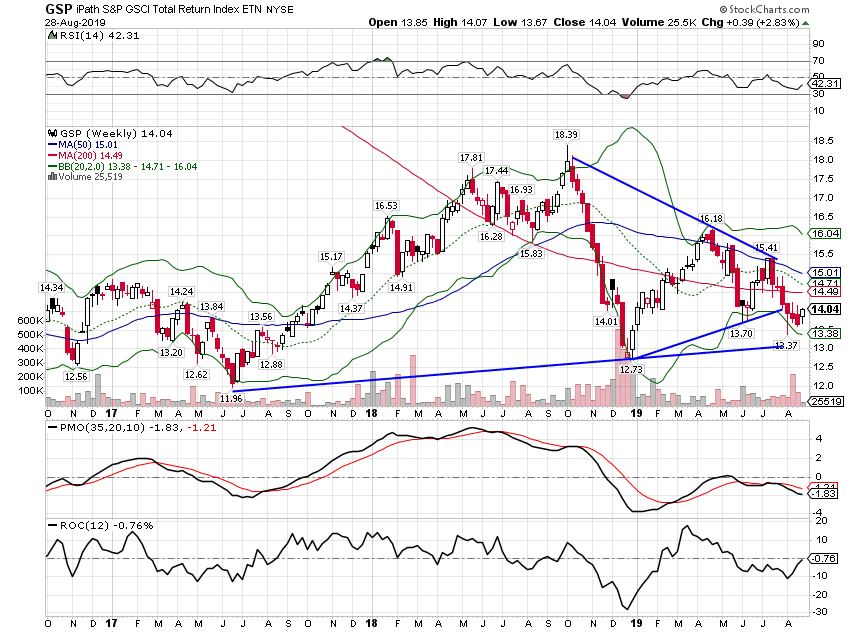
| The GSCI is more heavily weighted to energy – crude mostly – and it has done a bit worse than the BCOM. It has been volatile but measured from 2017, it is still in an uptrend. |
GSP, Weekly Oct 2017 - Aug 2019 |
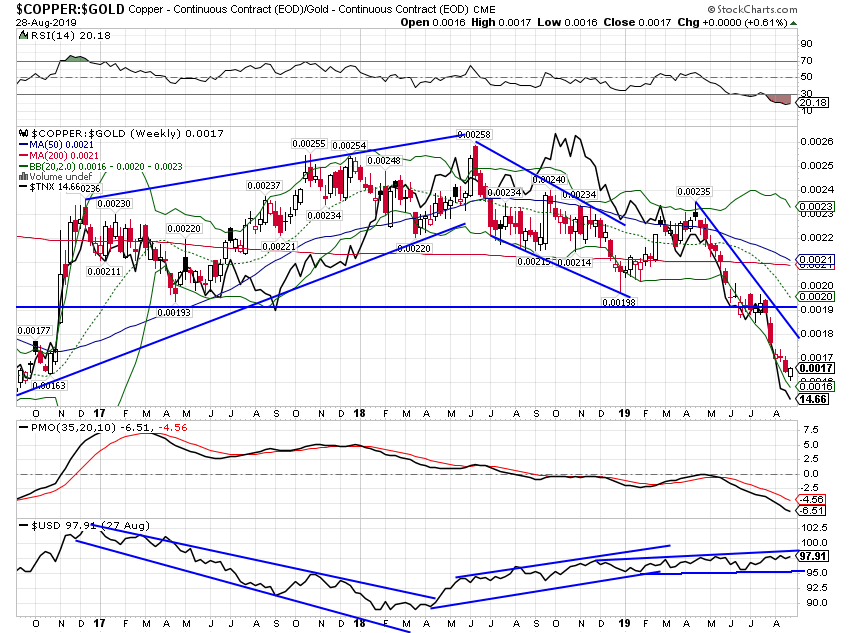
Copper: Gold RatioAs I said above the copper:gold ratio has completely fallen out of bed. I don’t know whether bond yields follow this ratio or the ratio follows the bond yields but they are strongly correlated (the black line is the 10 year Treasury yield). |
Copper:Gold, Weekly, Oct 2017 - Aug 2019 |
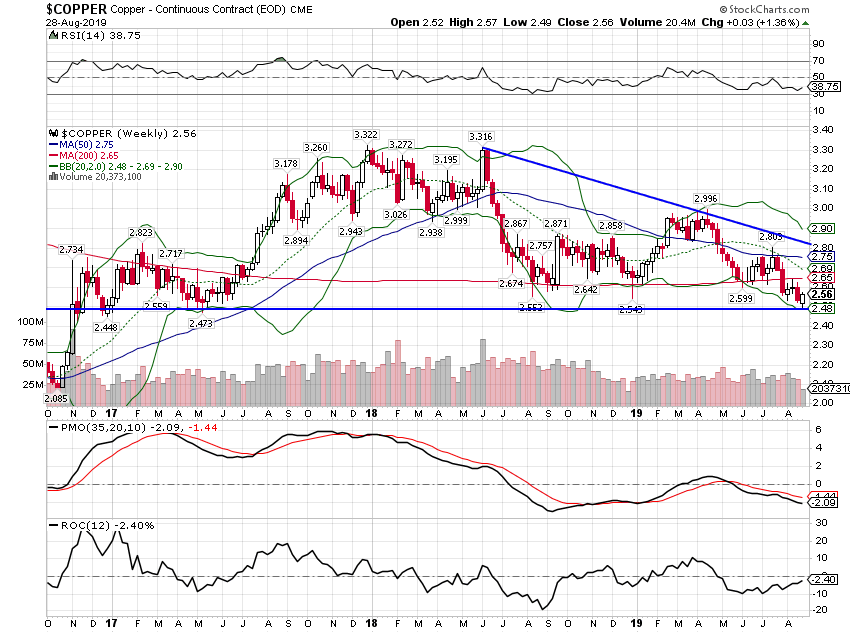
| The drop in the ratio though is not so much about copper. Yes, copper prices have fallen but it is about flat on the year and holding support for now. Specs are quite short the red metal in the futures market too so any sign of economic rebound and you could see a big move higher. |
Copper Weekly OCt 2017 - Aug 2019 |
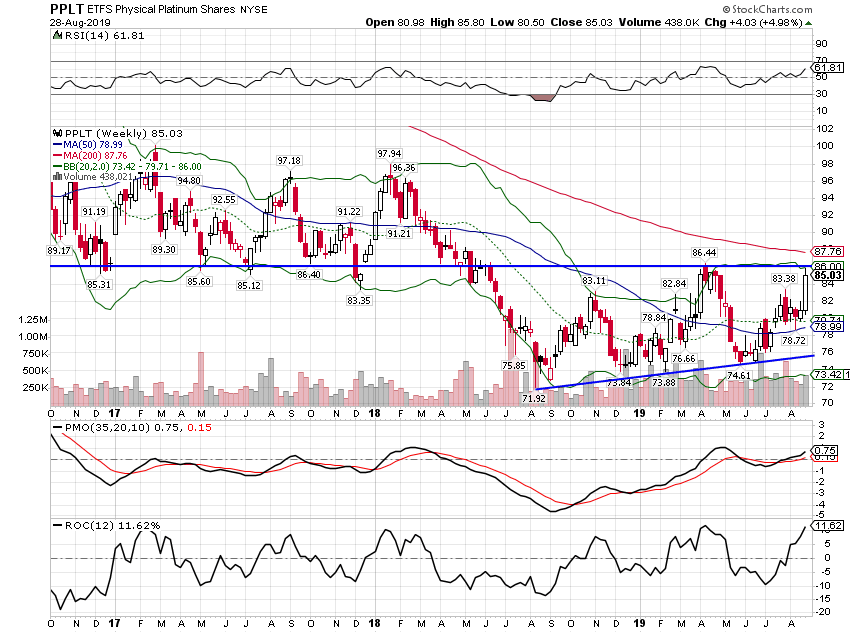
PlatinumNow this is an interesting one. Platinum has been down a long time, a victim of the diesel emissions scandal and subsequent drop in diesel vehicle sales. It is also used in gasoline catalytic converters but a lot of that was switched to cheaper palladium in recent years. Except palladium is no longer cheaper but rather quite a bit more expensive and car makers may just shift back to platinum. Platinum has also fallen significantly below the price of gold and you may see jewelry uses pick up as well. There are also industrial and medical uses. Platinum has been cheap for quite a while but there may finally be some catalysts to move it higher. Does it mean anything about global growth? I don’t know but it sure isn’t a negative. |
PPLT Weekly, Oct 2017 - Aug 2019 |
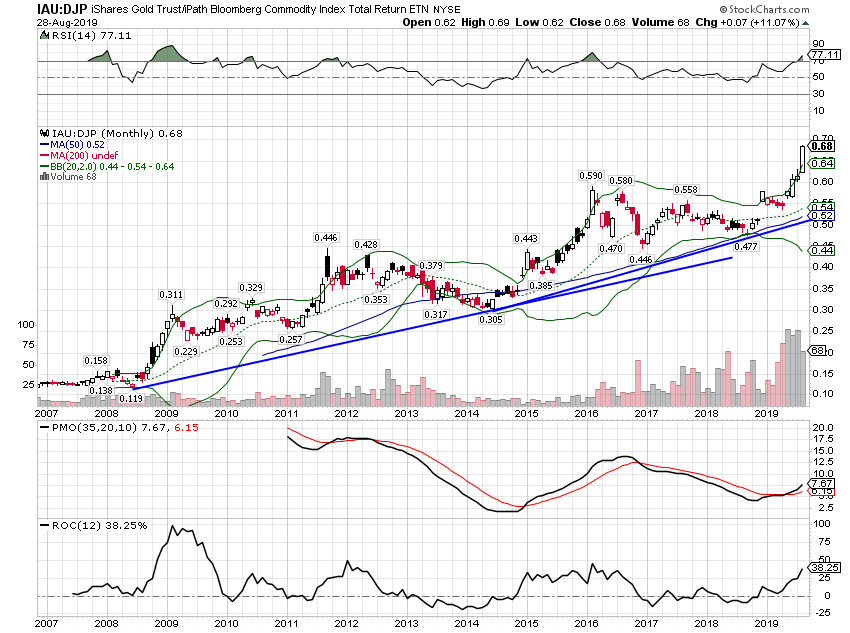
Gold:BCOM ratioOne last indicator this month. Gold has vastly outperformed the general commodity index and I would expect a pull back at least to the trend line. Think about what that would mean for a minute. To get this ratio to pull back we will need to see some combination of general commodity strength and gold weakness. What could cause that? Just food for thought. |
IAU:DJP Monthly, 2007 - 2019 |
The move in the Treasury market has been extreme and fear in the market is palpable. But for now, the only market confirming that fear is the gold market. Even if the Treasury market ultimately proves prescient I would not expect that to be confirmed soon. Markets don’t usually move in straight lines and a snapback in yields and a correction in gold would make perfect sense right about now. It would certainly surprise a lot of people, something markets have a habit of doing.
Tags: Alhambra Research,Bonds,commodities,Copper,copper to gold ratio,credit spreads,currencies,Featured,Gold,Markets,Monthly Macro Monitor,newsletter,platinum,TIPS,treasuries,US dollar,Yield Curve

