The risk budget is unchanged again this month. For the moderate risk investor, the allocation between bonds and risk assets is 50/50. Decoupling anyone? That’s what the market is whispering right now, that the recent troubles in foreign economies is contained and won’t affect the US. The most obvious example of that trend is the performance of US stocks versus the rest of the world. I am painfully aware of the divergence in performance as I have had the temerity to try and diversify my portfolio away from very expensive large-cap US stocks. That has been a mistake for going on a decade now and one has to wonder if diversification is still the free lunch Harry Markowitz thought. The bill for continuing to believe it
Topics:
Joseph Y. Calhoun considers the following as important: 5) Global Macro, Alhambra Research, China, Featured, Global Asset Allocation Update, newsletter, The United States
This could be interesting, too:
Nachrichten Ticker - www.finanzen.ch writes Die Performance der Kryptowährungen in KW 9: Das hat sich bei Bitcoin, Ether & Co. getan
Nachrichten Ticker - www.finanzen.ch writes Wer verbirgt sich hinter der Ethereum-Technologie?
Martin Hartmann writes Eine Analyse nach den Lehren von Milton Friedman
Marc Chandler writes March 2025 Monthly
| The risk budget is unchanged again this month. For the moderate risk investor, the allocation between bonds and risk assets is 50/50.
Decoupling anyone? That’s what the market is whispering right now, that the recent troubles in foreign economies is contained and won’t affect the US. The most obvious example of that trend is the performance of US stocks versus the rest of the world. I am painfully aware of the divergence in performance as I have had the temerity to try and diversify my portfolio away from very expensive large-cap US stocks. That has been a mistake for going on a decade now and one has to wonder if diversification is still the free lunch Harry Markowitz thought. The bill for continuing to believe it prudent to own a variety of assets has been particularly steep this year. |
Moderate Allocation, Sep 2018 |
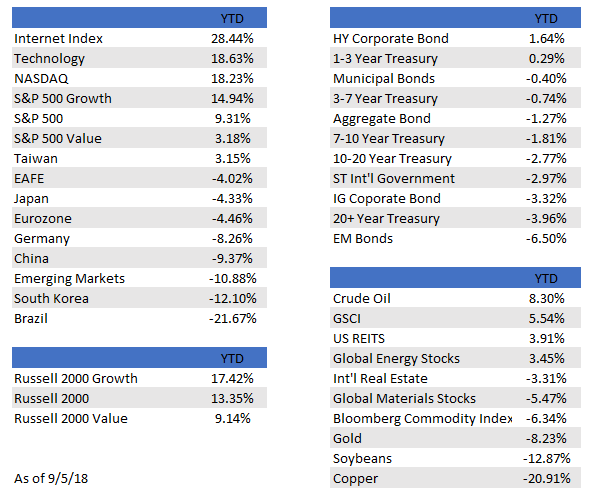
| There are only a few assets that have generated positive returns this year and many of those show significant overlap. The NASDAQ is up over 18% this year but that was driven to a large degree by technology (+18.63%) and more specifically, internet stocks (+28.44%). A similar story shows up in the S&P 500 (+9.31%) where gains have been concentrated in the growth half of the index (+14.94%), while value has barely registered a gain (+3.18%). Same with commodities where the GSCI is up (+5.54%), but that is entirely due to crude oil (+8.3%). The more diversified Bloomberg Commodity index is down (-6.34%) because other commodities like copper (-20.91%) and soybeans (-12.87%) – both victims to some degree of the Trump trade war – are getting hammered.
Bonds haven’t been any help for the balanced investor with only two categories marginally higher and one of those is really a risk asset (HY Corporate bonds, +1.64% and 1-3 Year Treasury index, +0.29%). Losses in other categories range from -0.40% (munis) to -6.5% (Emerging market $ bonds). But the decoupling aspect is more about foreign stock markets, where winners are very hard to find. Taiwan is a lonely exception (+3.15%) in non-US dollar markets, which have had a rough year and particularly rough August. EAFE, the broad foreign market index, is down over 4%, which is a home run compared to emerging market stocks, which are hitting bear market territory today from their highs and double digits YTD (-10.88%). |
 . |
Some of the foreign market underperformance is due to the recently strengthening dollar, reducing returns for US investors; but this isn’t just a currency conversion issue. A stronger dollar is both a cause and an effect. The dollar is stronger because capital has been leaving EM and foreign developed markets and landing in the US. Part of that is due to the poor performance of some of those economies (Turkey, Argentina, Brazil), some due to divergence in monetary policy (Europe), and some because US economic growth has been pretty good. As the dollar strengthens from those factors, it starts to weigh on other economies with large US dollar debts (China, Indonesia, and many others) which creates capital flight from those markets back to the dollar which rises and creates more pressure on foreign economies. That is the simplified, classic contagion scenario feared by everyone who invests in these markets.
Since 2008, a number of issues have caused angst among investors. Remember the PIIGS that were going to be the end of the Euro? How about the US debt ceiling debates and the credit downgrade from AAA? Greece’s bailout? Italian elections? Brexit? Emerging market problems (the 2014 version)? Chinese Yuan devaluation? Greek bailout again? Italian elections again?
In the decade since the actual financial crisis in 2008, investors have met each of these new challenges with selling in the country or area having a problem and in the US and other developed markets as well. There has been a persistent worry that this latest “crisis”, whatever it might be, is the next big one, the next global contagion that threatens the entire financial system. Each time though, the worries have proven unfounded and markets have turned around.
But in this latest iteration of the eternal EM crisis, US stocks seem to be immune from foreign turmoil, standing nearly alone in the green column. The question for diversified, balanced investors, is why? There are a number of possibilities.
The US fortress theory is that the US economy is just so strong that whatever happens in faraway lands just won’t have an impact. This is also the preferred scenario of the Trump administration who believe that US strength gives them the space to pursue tough trade negotiations with friend and foe alike. For a number of years early in the recovery from 2008, the US was referred to as the “cleanest dirty shirt in the laundry”, a kind of damning with faint praise where the US economy wasn’t great but it was better than everywhere else.
But today, that dirty shirt metaphor isn’t reckoned to be necessary as the Trump tax cuts, deregulation, and tariffs have set the US economy on a higher growth path. There is some support for that argument, but frankly, I find it wanting despite its popularity. US economic growth did accelerate from Q1 to Q2 but the change was not that unusual and the year-over-year growth rate of 2.9% is just a little above average for this economic cycle. And while bonds are down this year (yields up), a 2.8% yield on the 10-year Treasury and all of 80 basis points on the 10-year TIPS is not supportive of the boom theory the stock market – and Larry Kudlow – wants so badly to believe.
The strong dollar explanation is related to the fortress theory. Three factors are said to be bringing capital back to the US and raising the value of the dollar: strong US growth, tariff barriers, and repatriation of US companies’ foreign profits. As I said, there is some truth to the strong growth idea but one quarter is not a trend. Yes, growth did accelerate in Q2 but how much of that was due to activities intended to alleviate the harm of potential and actual tariffs? I don’t think we can actually quantify that but I have no doubt that some orders were brought forward in an attempt to avoid tariffs. I have spoken to a number of companies who are hoping that they stockpiled enough to last until the trade tiffs blow over, assuming they do.
I am also quite skeptical that any company is relocating manufacturing facilities already based on tariffs which could turn out to be temporary. Yes, there have been some companies who have made announcements to that effect but these things take time and they are expensive. Are companies actively making changes to their supply chains because Canada hasn’t signed onto the US-Mexico trade deal yet? I have my doubts.
As for repatriation of US companies’ foreign profits, I’m not sure how many times this has to be debunked but here goes again. Those profits were already largely in dollars, sitting primarily in US dollar-denominated bonds, mostly corporates. If anything, the repatriation of this capital will have a negative impact on corporate America as the demand for corporate bonds wanes somewhat. Overall though, frankly I don’t think there was much of an impact except on stock buybacks.
Lastly, it is widely assumed that the divergence in monetary policy globally is pushing the dollar higher and negatively impacting foreign economies, emerging ones in particular. It is certainly true that the US Fed is raising interest rates and shrinking its balance sheet. It is also true that the ECB, BOJ, and PBOC are all still easing in some form or fashion. But how that all plays out in this complex global economy I think is not as simple as the currency with the highest yield wins. Our take on QE is that the impact was largely psychological rather than physical and, if true, that makes its unwind as easy as predicting human behavior on a global basis. Good luck with that.
But it isn’t objective reality that drives markets but rather perception. And the perception right now is that the US economy is a lot better than the rest of the world – a widening gap – and the Fed will keep tightening. Markets are positioned for that to continue and in several instances the positioning is pretty extreme. This is George Soros’ theory of reflexivity in action. Perception that the US economy is better than the rest of the world spurs trading that turns perception into reality. Emerging market economies are harmed by capital outflows while US markets benefit from the capital inflows which reinforces the perception and the associated trades.
But markets don’t stay at extremes forever and capital flows – especially when it flows primarily into trading markets – aren’t the only factor affecting economic growth. In the futures markets, speculators are holding extreme bets on continued strong US growth.
Large speculators are:
- Near record short 10-year treasuries – Strong US nominal growth
- Moved from very long gold to small short – Strong US real growth
- Moved from slightly short the US Dollar index to medium size long – Strong US growth relative to the rest of the world
- Moved from record long Euro to small short – Strong US growth relative to Europe
- Very long crude oil and gasoline – Strong US growth; last commodity domino to fall?
- Massively short eurodollars – Strong US growth
There are some positions that are at least a little contradictory:
- Moved from very long copper to small short – weak growth
- Moved from long $C and $A to pretty good size short – weak commodity prices
- Again short 2-year note but fairly small size – Potential for a Fed pause?
The first two of those are still somewhat supportive of the strong US growth position. Copper isn’t as good a predictor of economic growth as the Dr. Copper moniker – the commodity with a PhD in economics – gives it credit for. A strong dollar – which tends to coincide with strong US growth – is generally negative for commodities, including copper. The Aussie and Canadian dollars are highly correlated with commodity prices so they are hurt by a strong US dollar as well.
The position in the 2-year note is interesting though because it is the one indication that doesn’t seem to line up with the strong dollar thesis.
Those betting on strong growth have been rewarded so far this year. Bond yields are up for the year but speculators are generally trend followers, not leaders. The 10-year Treasury note yield is today no higher than it was in February. And a lot of the short position in the futures market was built after the rise. Speculators are betting, in near-record numbers, that the uptrend in rates will continue. The same is true of the long US Dollar position, where specs were short coming into 2018.
In some ways, the most surprising thing about what is going on is that the rise in the US dollar is actually fairly muted. It is certainly true that the Turkish Lira and the Argentine Peso have been clobbered but in the big scheme of the global economy, those are bit players. The Euro has pulled back too, but that comes after a move from 103 to 125 last year. A move, by the way, that caught speculators completely wrong-footed with sizable short positions at the beginning of 2017 just as the Euro was about to run up 20%+.
Likewise, the interest rate complex. Speculators were short the 10-year Treasury in size at the beginning of 2017 right before a sizable rally. Now, they are short in record size and I find it hard to believe that they will be any more right now than they were then.
A contrarian position right now would involve being short the US Dollar and long Treasuries, a position that implies a moderation in US growth over the coming months. What might cause a slowdown? The most likely source of trouble is, without a doubt, the ongoing trade negotiations. Companies are not going to invest for the long term when the future of their supply chain is dependent on the whims of the Presidential Twitter account. We haven’t seen much evidence of it yet but the longer this drags on, the more likely companies are to put investments on hold – and that includes hiring by the way.
While I am not happy about the performance of our diversified portfolios recently, I see no reason to make wholesale changes based on the artificial distortions being caused by the Trump trade war. Being contrarian isn’t easy, that’s for sure, but history says that when sentiment is this lopsided, it pays to fade the crowded trades.
Yield Curve/RatesThe yield curve flattening trend is intact although the curve steepened slightly at the end of August. That minor steepening was due to a small rise in the 10-year yield as the 2-year yield flatlined. Such a steepening might not be a negative if it is based on rising real growth expectations. In other words, we would want any rise in the nominal 10-year to be matched by a rise in the 10-year TIPS yield. The 2-year yield actually fell slightly in August and is now barely above the rate of late May. The short end of the curve seems to be anticipating a Fed pause but there is little support for that notion at this point, at least not in the economic data. It doesn’t explain the whole month but Powell’s speech at Jackson Hole on August 24th struck me as a very pragmatic approach to policy and potentially supportive of a pause. He does not seem enamored much of models of the economy, preferring to observe the markets’ perception of the economy. Specifically, he seemed to indicate that the market’s view of inflation expectations was more important than the FOMC’s guesses about the future. If Powell really is concentrating on inflation expectations, that would seem to be a weak form of NGDP targeting and with inflation expectations steady, a pause could certainly be justified. |
Yield Curve - 2 Year Bonds Index |
| Or maybe the 2-year is just resting and I’m reading way too much into short-term movements (or lack thereof).
The 10-year yield fell in August but started to rise at the end of the month. Whether that was due to Powell’s speech or not, I can’t say, but if Powell is pursuing an NGDP targeting strategy – and the market expects it to succeed – then a steepening curve with a rising long end makes sense. Why? Nominal GDP (NGDP) has, over the years, generally tracked the 10-year Treasury yield but this cycle the rate has consistently traded below the change in NGDP. I can’t say exactly why that has happened but my guess is that there is still a residual fear of another 2008 like event somewhere in our near future. If the market comes to believe that Powell can and will maintain NGDP growth at or above current levels, the 10-year yield should rise to that level. |
2-Year Treasury Yield Index |
| For now, though, the 10-year yield continues to trade in a range after the initial rise in early February. Based on the futures market positioning, I would expect to eventually break out of this range to the downside. We might get that even with a Fed pause as the knee jerk reaction would probably be a rally in bond prices. |
10-Year US Treasury Yield Index |
| The 10-year TIPS yield was down by 8 basis points for the month as real growth expectations moderated slightly. Yields did tick up just a tad at the end of the month, following the nominal 10-year yield. |
10-Year Treasury Inflation-Indexed Security, 2013-2018 |
| The inflation expectations Powell placed so much emphasis on in his speech have been steady and right around the Fed’s target. If that continues, Powell could use that as justification for a pause to see how the economy performs. |
10-Year Breakeven Inflation Rate, 2013-2018 |
Credit SpreadsCredit spreads widened by all of 3 basis points in August. Spreads have been around these levels since the spring of last year but as you can see they traded tighter in the last two cycles so they could still go lower. Bottom line is that there is no indication of stress in the junk bond market. |
ICE BofAML US high Yield Master II Option-Adjusted Spread, 1998-2018 |
Valuations
I know I sound like a broken record when I say that US stocks are very expensive, but it is no less true today than it has been for the last three years. Non-US stocks are where value is found and that too is the same as it was three years ago.
Japan is my favorite example of what is available to investors if they just take the time to look. Japan trades at about 12 times next year’s estimates and for the April-June quarter, earnings were up nearly 30%. 24% of listed companies booked record profits and stocks trade for just a tad over book value. Revenue grew by 8%, the highest quarterly rate in five years. Manufacturers profits jumped by 41%. Net margins for non-financial companies hit 7.7% in the latest quarter which compares quite favorably with the US, where margins have fallen back from the 2012 peak to about 9%. And as those US margins were peaking and pulling back, Japan’s were rising from around 4%. Japanese companies, unlike their US counterparts, have not leveraged up over the last few years, holding over $2 trillion in cash on their books.
And lastly, the Yen has been fairly stable in recent years. Abenomics initially reduced the value of the Yen but it has traded in a fairly narrow range since 2016. I’m not sure how much more anyone would want in an equity market but apparently Japan needs more, because about the only way Japan doesn’t compare favorably with the US is in market returns.
There are plenty of cheap stocks in the world but investors continue to insist on paying top dollar for US companies. Value isn’t very valuable anymore.
MomentumThe dollar finally broke out above the 95 level it had been challenging since May but the trip higher was short lived. The trend though is up for now and that will continue to weigh on non-dollar denominated assets. While foreign stocks have struggled, the S&P 500 has marched steadily higher since the February correction. It has been a narrow affair though with Value index is up just 3.12%. More specifically, the Momentum index is up 17.8%. Amazon, which started the year richly valued, is up another 65%. Netflix has recently suffered a nearly 15% correction and is still up nearly 90% for the year. Both have forward P/Es – which are basically useless and always wrongest at the top – in the 80 range but at 11 times sales, Netflix better keep the hits coming. And Amazon? It is interesting to me that they are pursuing a strategy today that looks a lot like Walmart’s business model. I would just note that Walmart stock is quite a bit cheaper (no that isn’t a recommendation). |
US Dollar Index 2018(see more posts on US Dollar Index, ) |
| Momentum is obviously with the growth and momentum names but you pay a very high price for participating in those areas of the market. |
S&P 500 Large Cap Index(see more posts on S&P 500 Large Cap Index, ) |
| Confirming the narrowing trend is the recent underperformance of small cap stocks versus large cap. This rally to new highs is a big company party. |
iShares Russell 2000 ETF/SPDR S&P 500 ETF |
| Foreign stocks are not participating despite generally favorable fundamentals. EAFE stocks held their own against their US counterparts in 2017 but the downtrend has resumed with a vengeance. It is interesting though that the Euro has actually acted pretty well against the dollar and is significantly above the lows set in early 2017. The Euro rallied from around 103 to 125 in the space of a year but has so far only given back less than half that gain which is pretty normal, all things considered. Long term momentum for the Euro remains positive and I intend to maintain our exposure to EAFE for that reason. In the long term, currencies tend to be the driving factor in relative performance between US and non-US stocks. |
iShares MSCI EAFE ETF/SPDR S&P 500 ETF |
| The uptrend of Japan versus the broader EAFE index is intact although YTD the indexes have similar performance. Over the last year, EWJ has outperformed EFA by about 3.5%.
Emerging market stocks have gotten a lot of attention recently with high profile troubles in Turkey and Argentina. However, the weighting of these countries in the EM equity index falls into the “other” category, which totals less than 4% of the index. The real problem is China which is over 30% of the index and where stocks are in a bear market. That is driven primarily by the Trump administration’s trade war but there are other problems as well. |
iShares MSCI Japan ETF/iShares MSCI EAFE ETF |
| The rising dollar has also obviously played a role in the EM sell-off as these countries do have a lot of dollar-denominated debt. Several EM currencies have been hit recently – Turkey and Argentina most – but the Chinese Yuan is only down about 8% from its high. While that is a fairly large move, it isn’t a crisis level move.
EEM is down nearly 20% as I write this but that type of correction after a big run up in EM is not unusual – returns are always “lumpy” in emerging markets. We first added EEM to our portfolio in July 2016 and this correction is just that to us – a correction. If you are going to use emerging markets in your portfolio you have to be prepared to ride out these kinds of moves. Our position in EM is quite small in any case at just 3%. |
iShares MSCI Emerging Markets ETF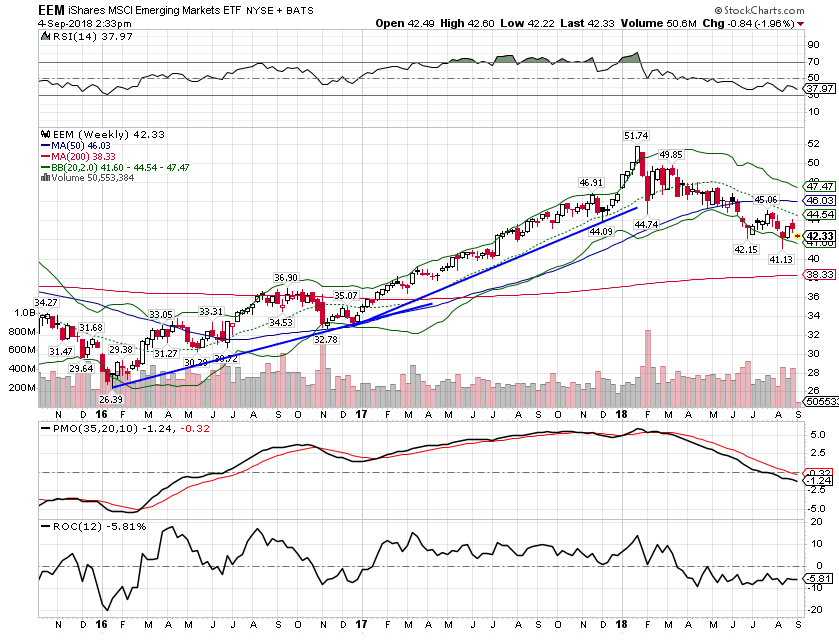 - Click to enlarge |
| Recent relative performance of EEM vs SPY takes us back to the lows of 2016, but I contend that this is all part of the topping process of the dollar and the bottoming process of weak dollar assets like EM. The outperformance of large cap US stocks – especially large cap growth/momentum stocks – is really unprecedented. Diversification is supposed to confer benefits but that hasn’t been the case for nearly a decade now. |
iShares MSCI Emerging Markets ETF/SPDR S&P 500 ETF |
| EEM has also underperformed EFA recently but has outperformed since the bottom in 2016. |
iShares MSCI Emerging Markets ETF/iShares MSCI EAFE ETF |
| A rising dollar has also pulled commodities down but like EM, commodities performed very poorly from 2011 to 2016. And like EM, when the dollar resumes its downtrend, commodities will start moving higher again. |
Bloomberg Commodity Index 2016-2018 |
| The dollar has also pulled down gold prices but the decline is within the boundaries of the recent trend. Momentum, however, is weak and needs to turn higher before the end of the month. |
Gold - Continuous Contract 2006-2018 |
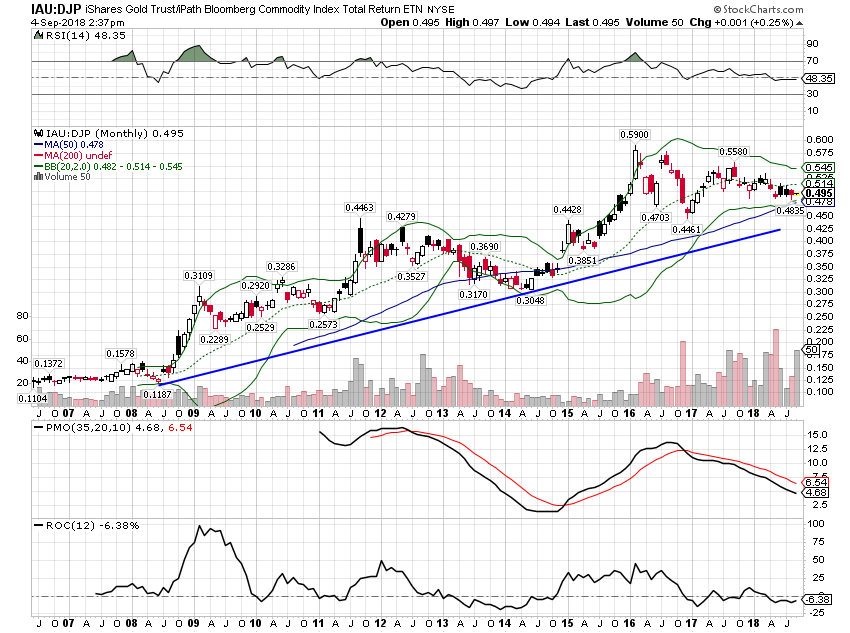
| From a long-term perspective gold’s trend versus a general commodity index is still positive. However, the uptrend was interrupted in 2016 as general commodity prices came off their lows. The future of this trend is mostly a function of growth expectations in the US. If growth expectations remain fairly strong, gold will probably underperform the general commodity index. |
iShares Gold Trust 2007-2018 |
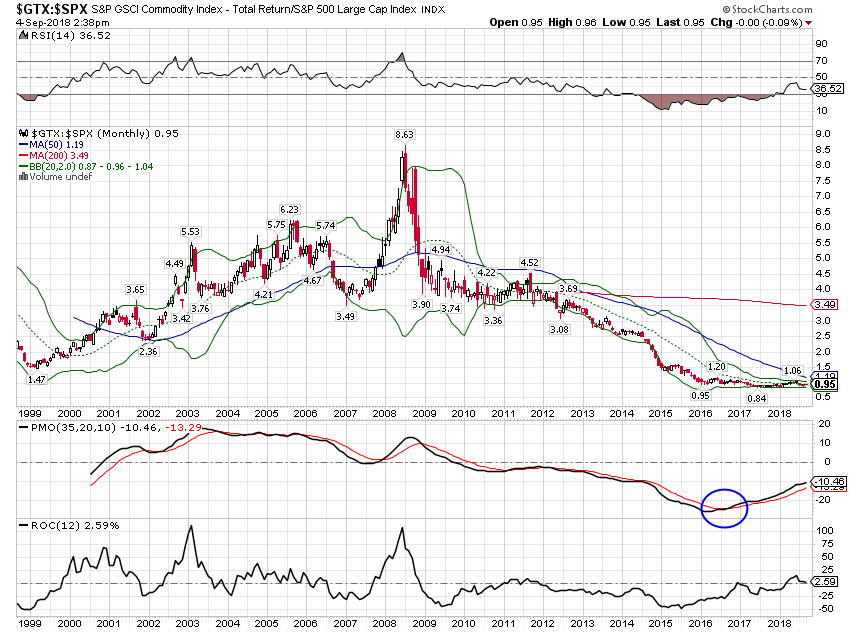
| This trend started a bottoming process a couple of years ago when commodities finally hit bottom. Despite the recent fall in commodity prices, the GSCI has basically matched the performance of the S&P 500 since 2016. These trends are very long term and generally driven by the dollar. However, we believe the transition to a higher inflation environment is well underway. Long term momentum continues to favor commodities. |
S&P GSCI Commodity Index / S&P 500 Large Cap Index 1999-2018 |
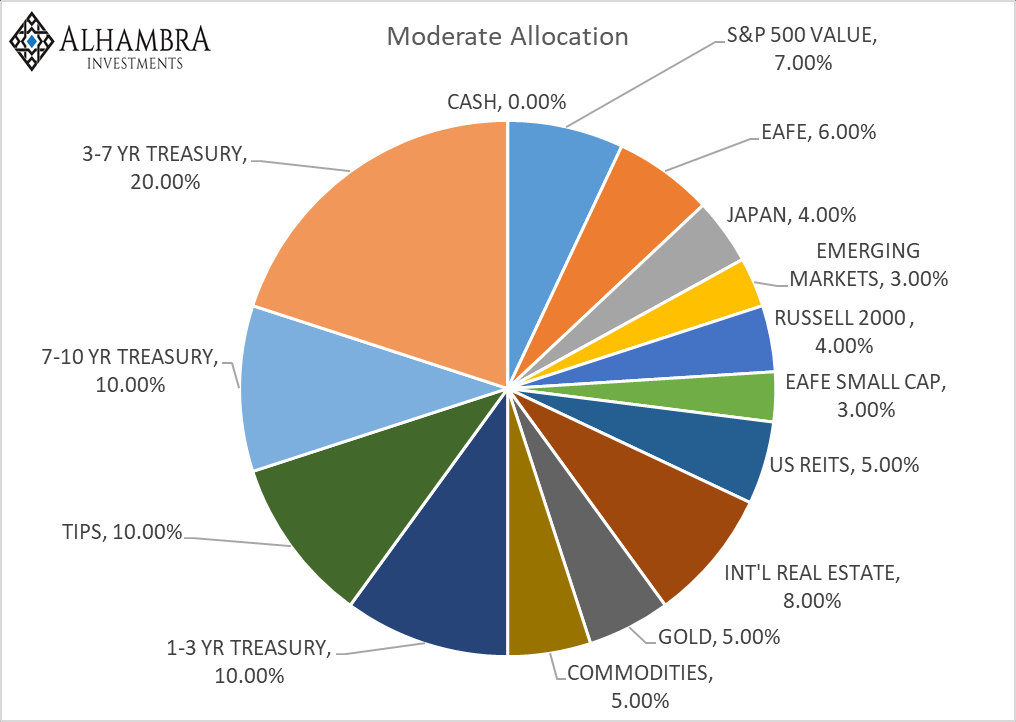
| There are no changes to the portfolios this month: |
Moderate Allocation, Sep 2018 |
Tags: Alhambra Research,Featured,Global Asset Allocation Update,newsletter


