The Next Great Bull Market in Gold Has Begun – Rickards on Peak Gold And Technicals – ‘Gold is in the early stages of a sustainable long-term bull market’ Rickards – Rickards believes the next bull market in gold will be even more powerful than those of 1971–1980 and 1999–2011 – This new rally could send gold ,475 or higher by next summer thanks to Fed rate hikes – Warns of Peak Gold ‘Physical gold is in short supply. Refiners can’t get enough to meet demand.’ – ‘Now looks like a good time to jump on board to enjoy the ride’ – The Axis of Gold ‘continue to buy gold overtly and covertly in prodigious quantities.’ Gold Price in USD, July 2008 - October 2017(see more posts on Gold prices, ) - Click to enlarge The
Topics:
Jan Skoyles considers the following as important: Daily Market Update, Featured, gold prices, GoldCore, newsletter
This could be interesting, too:
Nachrichten Ticker - www.finanzen.ch writes Die Performance der Kryptowährungen in KW 9: Das hat sich bei Bitcoin, Ether & Co. getan
Nachrichten Ticker - www.finanzen.ch writes Wer verbirgt sich hinter der Ethereum-Technologie?
Martin Hartmann writes Eine Analyse nach den Lehren von Milton Friedman
Marc Chandler writes March 2025 Monthly
| The Next Great Bull Market in Gold Has Begun – Rickards on Peak Gold And Technicals
– ‘Gold is in the early stages of a sustainable long-term bull market’ Rickards |
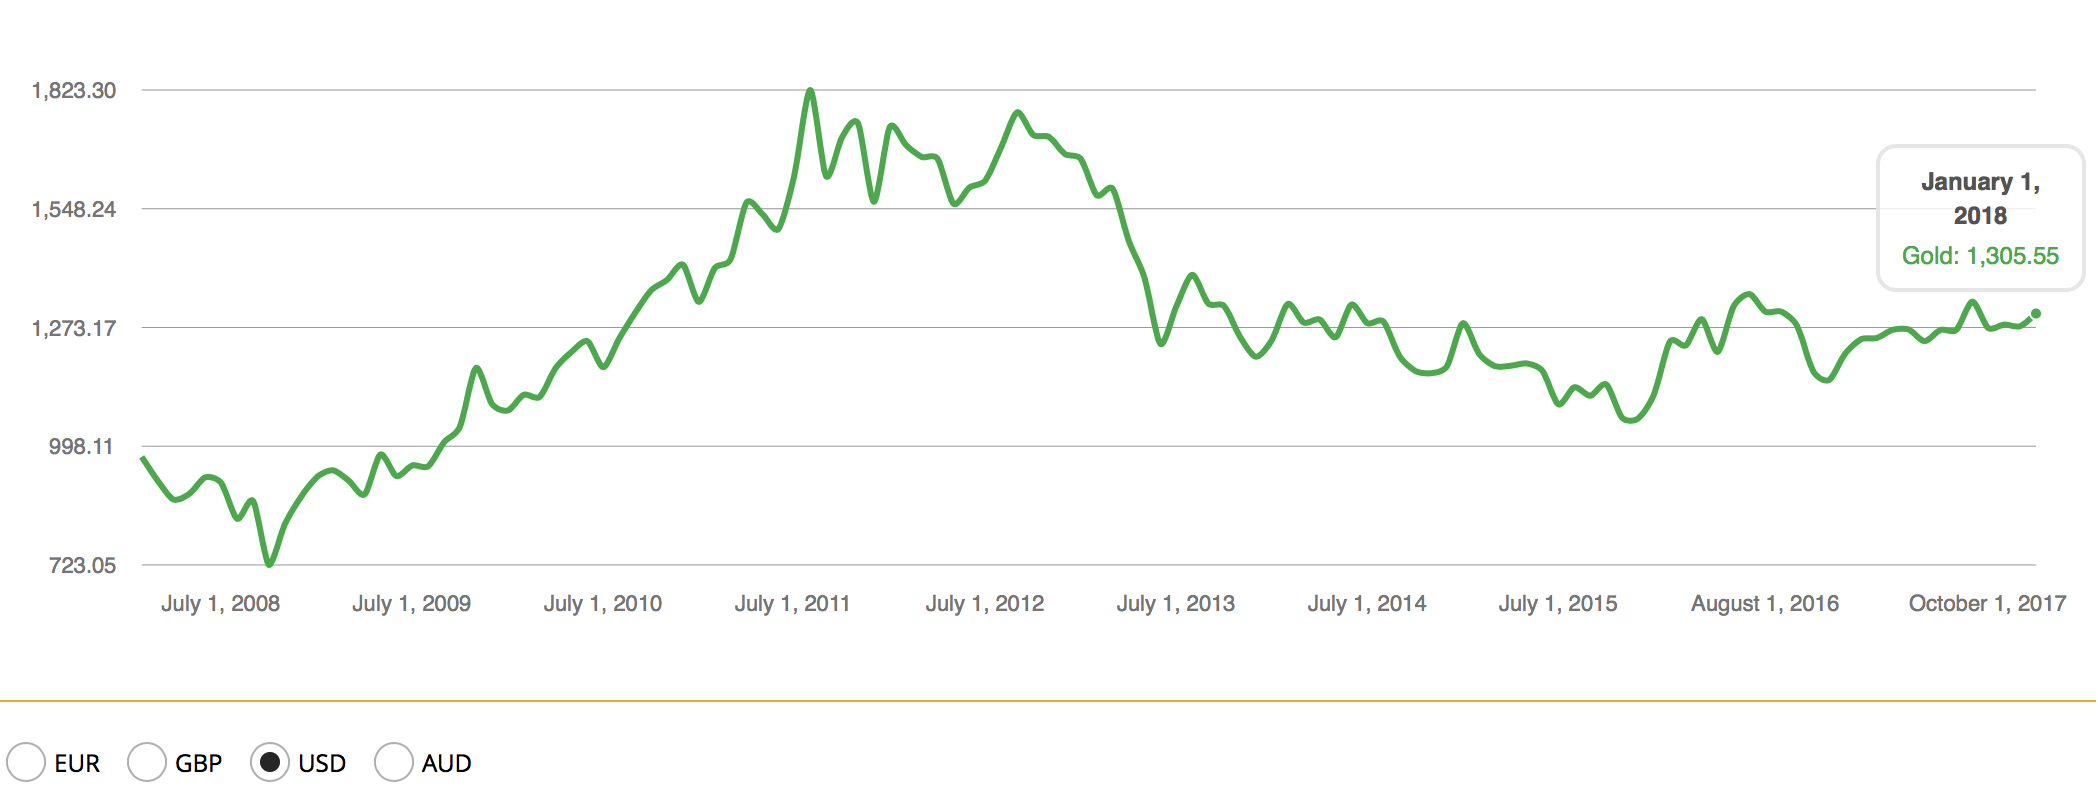
Gold Price in USD, July 2008 - October 2017(see more posts on Gold prices, ) |
The below was written by Jim Rickards for The Daily Reckoning.
|
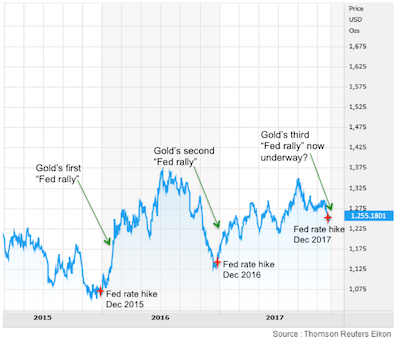
Gold's Fed Rally, 2015 - 2017 |
| Of course, nothing moves in a straight line. There will be new drawdowns to go along with the new rallies. But the upward trend seems well-established at this point.
Some of this price action following the three December rate hikes could just be noise or coincidence. We all learned in statistics class that correlation does not mean causation. And three events may correspond to the adage, but it’s not exactly a longtime series on which to build a statistical case. Still, it’s an intriguing pattern. Gold has a reputation for being the most forward-looking of all macro indicators. Gold investors smell trouble and opportunity long before stock and bond markets catch the scent. The fact that gold would rally after a rate hike is counterintuitive. Usually higher nominal rates equal higher real rates, which is poison for gold. Why the rallies? The gold market is looking through the rate hike and asking what comes next. After all, the December rates hikes in 2015, 2016 and 2017 were all advertised well in advance by the Fed and were fully discounted by the market. This means that the rate hike was a nonevent, because gold was already priced for it. Yet the rate hike itself and the Fed’s commentary suggest both a head wind for economic growth and possible Fed ease in the form of future inaction and forward guidance relative to expectations. That’s exactly what happened after the 2015 and 2016 rate hikes. If the Fed takes its time on future rate hikes because of weak growth and disinflation, the dollar will weaken and gold will get a huge lift. If the pattern of the last two years repeats this year, gold will reach a much higher level because it’s starting from a much higher level. The December 2015 rally started from $1,062 per ounce. The December 2016 rally started from $1,128 per ounce. This rally starts from $1,240 per ounce. This pattern of “higher highs and higher lows” has persisted through the past three years despite rallies and drawdowns along the way. If good things come in threes, then this was the third December rally in a row and could take gold back to the long-awaited $1,400-per-ounce level. Now looks like a good time to jump on board to enjoy the ride. What other evidence exists for the conclusion that we’re in a sustainable long-term bull market for gold and not just another false start? Peak Gold |
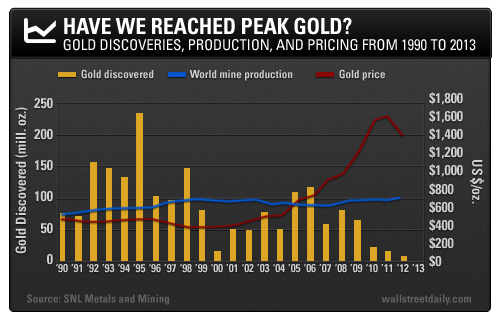
Gold Discoveries, Productiong and Price, 1990 - 2013(see more posts on Gold prices, ) |
| The most important fundamental factor in favor of higher gold prices right now is the imbalance between physical supply and demand. I have seen both sides of this equation firsthand.
On the supply side, I have visited gold mines in South Africa, Canada, Australia and the U.S. I have been to gold refineries in Switzerland and gold vaults in Sydney, Switzerland and New Castle, Delaware. I speak with gold dealers on an almost daily basis. On the demand side, I have met with government officials in Russia and China and with the senior officers responsible for gold trading at the biggest banks in China. In every visit and every conversation, I encountered the same complaint: Physical gold is in short supply. Refiners can’t get enough to meet demand. Miners are looking at five-year lead times on new discoveries and reopening old mines shut in during the price collapse of 2013–15. Vault operators are seeing the shift from bank storage to private storage, which reduces the floating supply needed to support the paper gold manipulations. Axis of Gold In addition, we are looking at several major gold spike catalysts in 2018, including a trade war with China and a shooting war with North Korea. Russia, China, Iran and Turkey, what I call the “Axis of Gold,” continue to buy gold overtly and covertly in prodigious quantities. The western gold powers such as France, Italy, Switzerland, Germany and the IMF have not sold an ounce of gold since 2010. The U.S. has barely sold an ounce of gold since 1980. On a worldwide basis, demand is up and supply is down, and that can only mean one thing in the long run — higher prices. This combination of fundamental, technical and geopolitical factors is converging in 2018 in a way we have not seen since the late 1970s. The new bull market in gold will be even more powerful than the 1971–1980 bull market and the 1999–2011 bull market. |
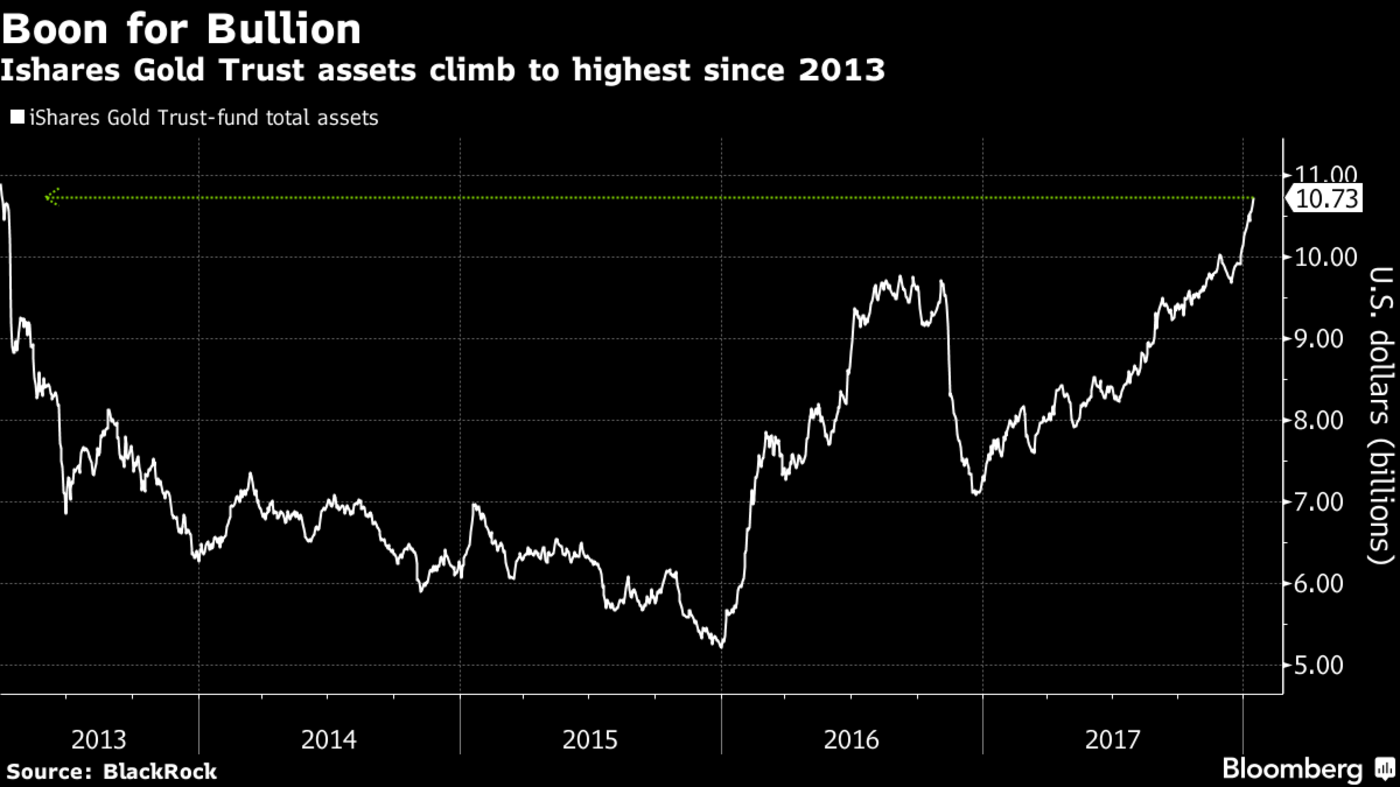
iShares Gold Trust-fund Total Assets, 2013 - 2018 |
Tags: Daily Market Update,Featured,Gold prices,newsletter


