Retail sales rose (seasonally adjusted) in March 2018 for the first time in four months. Related to last year’s big hurricanes and the distortions they produced, retail sales had surged in the three months following their immediate aftermath and now appear to be mean reverting toward what looks like the same weak pre-storm baseline. Exactly how far (or fast) won’t be known until subsequent months. US Retail Sales, Jan 2014 - Apr 2018(see more posts on U.S. Retail Sales, ) - Click to enlarge Unadjusted, retail sale rose 5.12% year-over-year. Despite those distortions last year, consumer spending appears more and more topped out around the same low levels as 2014. The 6-month average of 4.91% continues to be in a
Topics:
Jeffrey P. Snider considers the following as important: boom, consumer spending, currencies, economy, Featured, Federal Reserve/Monetary Policy, income, inflation, Labor market, labor shortage, Markets, newsletter, Retail sales, The United States, U.S. Personal Income, U.S. Retail Sales, wages
This could be interesting, too:
Nachrichten Ticker - www.finanzen.ch writes Die Performance der Kryptowährungen in KW 9: Das hat sich bei Bitcoin, Ether & Co. getan
Nachrichten Ticker - www.finanzen.ch writes Wer verbirgt sich hinter der Ethereum-Technologie?
Martin Hartmann writes Eine Analyse nach den Lehren von Milton Friedman
Marc Chandler writes March 2025 Monthly
| Retail sales rose (seasonally adjusted) in March 2018 for the first time in four months. Related to last year’s big hurricanes and the distortions they produced, retail sales had surged in the three months following their immediate aftermath and now appear to be mean reverting toward what looks like the same weak pre-storm baseline. Exactly how far (or fast) won’t be known until subsequent months. |
US Retail Sales, Jan 2014 - Apr 2018(see more posts on U.S. Retail Sales, ) - Click to enlarge |
| Unadjusted, retail sale rose 5.12% year-over-year. Despite those distortions last year, consumer spending appears more and more topped out around the same low levels as 2014. The 6-month average of 4.91% continues to be in a category different from past levels of economic health and growth. It is also practically the same as when retail sales growth peaked in September 2014 (5.03%). |
US Retail Sales, Jun 2011 - Apr 2018(see more posts on U.S. Retail Sales, )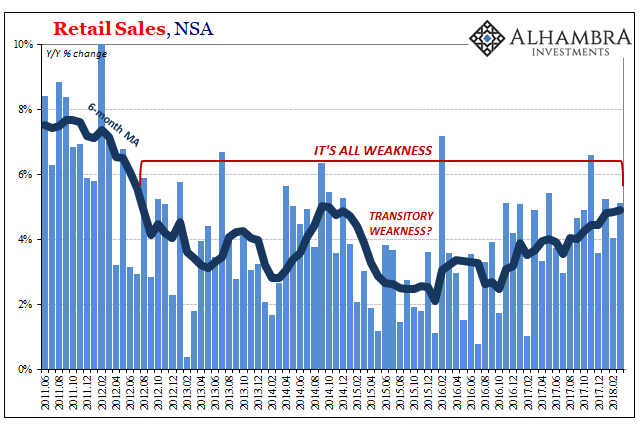 - Click to enlarge |
| It’s the lack of clear acceleration that demands our attention, with or without tropical disturbances. Past cyclical periods, including those related to near-recessions like 2015-16, are uniform in their “V” shapes. It may not quite be as flat as a perfectly scripted “L”, but after 2011 in particular that’s the closer symbolic reflection. |
US Retail Sales, Jan 1993 - Apr 2018(see more posts on U.S. Retail Sales, )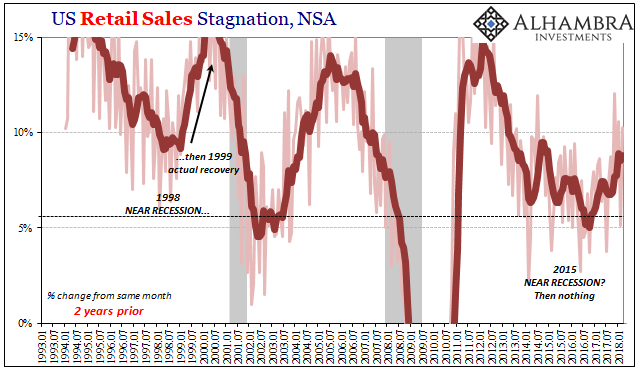 - Click to enlarge |
| The result is one of time, and the massive costs associated with the accumulation. The conspicuous absence of cyclical factors leads us toward explanations focused on structural symptoms and possible causes. |
US Retail Sales, Jan 1992 - Apr 2018(see more posts on U.S. Retail Sales, )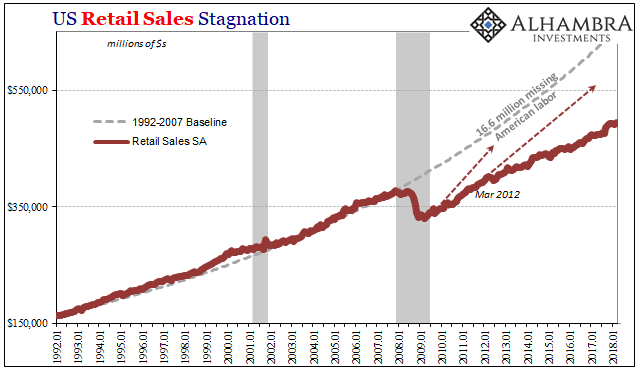 - Click to enlarge |
| In other words, how is the chart immediate above ever possible? To begin with, we have to recognize the universality of it as a matter of our current circumstances (much more than retail sales) while at the same time being left awestruck at its historical exceptionality. It’s not just that this isn’t supposed to happen, it isn’t supposed to be able to happen.
The indication of missing labor, as I’ve labeled directly on the prior baseline, is contentious. Much of any current discussion ignores this reality (the economy’s booming!), and where some discussion is allowed it centers around the increasingly ridiculous. Set aside the fact that you would actually have to believe that a substantial proportion of Baby Boomers decided all at once to retire during the worst economic and market crisis of the last four generations (when 401k’s were joked about being 201k’s), or that fentanyl and heroin would have to have been introduced and re-introduced at the very same time, though you are left with some required account for labor participation that’s not the only issue. A smaller percentage of Americans working only describes part of the disaster, though it remains the sole focus. What about those who are still working, and those who have been fortunate enough to find employment the last ten years? |
US Retail Sales, Jan 1993 - Apr 2018(see more posts on U.S. Retail Sales, ) - Click to enlarge |
| If we “deflate” retail sales by the number of purported payrolls (Establishment Survey) we illuminate these other hidden aspects. This ratio is largely free of the participation problem. We are calculating, roughly, how much spending a worker undertakes in a given month. There are, as always, smaller issues still, such as non-employment (transfer receipts) income that also feeds spending, but in the context of the post-crisis period those have been more not less generous.
As you would expect, there is a clear macro sensitive pattern to the trend. During periods of economic distaste, including both recessions and other periods trending down, uncertainty breeds hesitation and caution. This is why Economists spend so much time and effort trying to manipulate expectations; they clearly play a large role in these processes. |
US Retail Sales, Jan 1993 - Apr 2018(see more posts on U.S. Retail Sales, )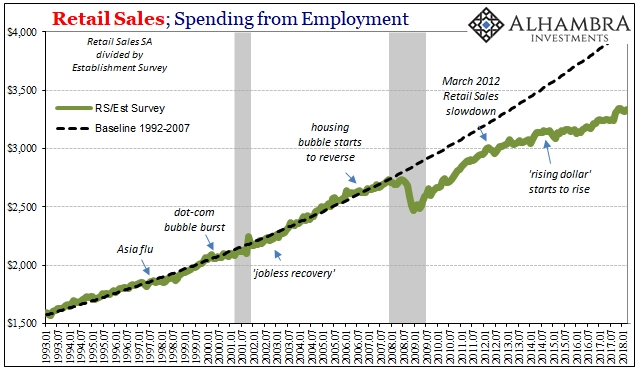 - Click to enlarge |
| But how do we account for what used to be more minor spending adjustments that have over the last decade become monstrously depressing? Again, the participation problem is not a direct factor in this calculation. We are only measuring retail sales per worker.
If the economy had recovered in true cyclical fashion from the Great “Recession” we would expect retail sales per payroll to recover the prior baseline, too. Even if Baby Boomers were retiring in droves, and the opioid crisis was decimating the labor force, those who were working should have at some point started spending again in the same manner as before. That would have left the economy with some big problems to overcome, less retail sales in absolute terms, but nowhere near as much when accounting for this other side. |
US Retail Sales, Jan 2007 - Apr 2018(see more posts on U.S. Retail Sales, )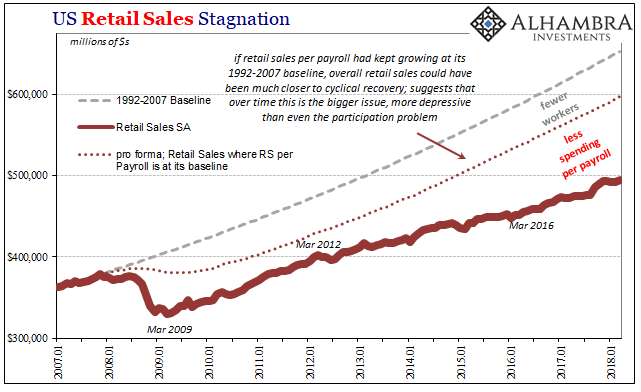 - Click to enlarge |
| Instead, what we find is macro-related in every sense – including the timing of additional shifts (downward) in the line. What would explain reduced spending per worker?
Several things, all related to the economic situation. First, there was substantial change in recovery mechanics where workers who weren’t laid off shifted to part-time employment – paying less per worker and almost certainly leaving these marginally employed to spend less per payroll. Though it has been better in recent years, there is still today far more part-time work proportionally (which some have blamed, incorrectly, on the imposition of Obamacare and its employer mandate) given the unemployment rate. |
Structural Labor Factors, Jan 1968 - 2018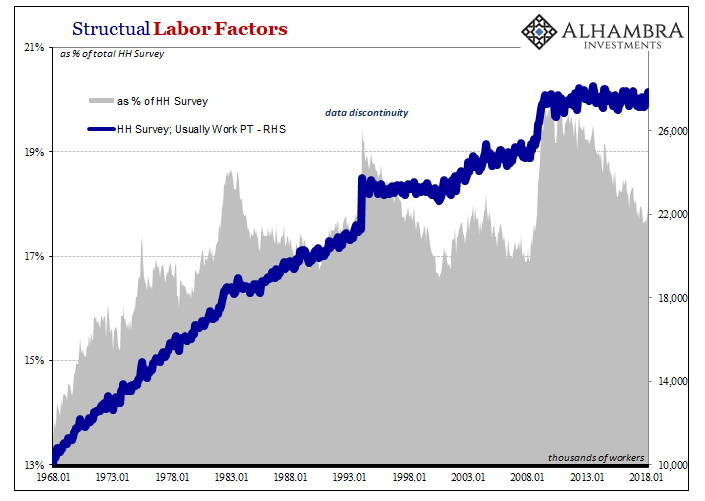 - Click to enlarge |
| But that’s only part of the spending equation. Relatedly, as the proportion of PT workers has remained high, so, too, has wage growth remained low. Not only are businesses employing more of the former, of their FT base they have also become distinctly less likely to award raises and other forms of pay increases. |
US Nonfarm Business Sector, Jan 1983 - 2018 - Click to enlarge |
| These are dimensions of business profitability. The trends within it detailed above describe an over-attention to managing costs, particularly labor costs. This is an entirely different category than that when healthy businesses in attempting to take advantage of opportunity prioritize that opportunity instead of the cost structure. The short way of saying that is businesses don’t want to pay workers because they have no reason to, and even if they thought there might be a reason they can’t. |
Corporate Cash Flow, Jan 1949 - 2018 - Click to enlarge |
This also explains the “labor shortage” we keep hearing about; if it was a real shortage predicated on economic (small “e”) conditions, it would have hit the news only when it started and then would have been completely overshadowed by subsequent pieces written only to describe the exploding wage growth resulting from it. There probably is some difficulty in hiring new workers, but that’s not at all the same as what the unemployment rate indicates. I wrote last year (and will likely have to refer to it again and again throughout this year, I suspect):
It’s in an incredibly simple answer: because they see no real reason to, a reflection of internal as well as external considerations and negative imbalances. Just today, yet another example of how unhelpful the Economics media has been in this regard. The Wall Street Journal reports, breathlessly, how companies are snapping up teenagers to deal with the LABOR SHORTAGE!!! Yet, (as M. Simmons helpfully highlighted for me) there’s a catch:
Desperate companies either way; either they really are having such a hard time finding any workers that they’ll take them right out of high school or unfinished in college; or, their cash flow and profit situations dictate they take even more extreme measures to avoid paying the market-clearing rate. Economic boom; or continued depression being described as one. You look at those charts above, particularly how they all break trend in 2008, and wonder what are these people talking about? It’s political rather than economic analysis, not in the sense of a particular party (though that happens and has happened) but more so about the state of Economics. If the 4.1% unemployment rate is legitimate, the technocracy did the absolute best that it could, to where no one should have expected any better, and is therefore off the hook for what happens next. The opposite, however, opens up a whole lot of substantial problems for this ugly status quo – that will get uglier the longer it continues without meaningful change. Another retail sales report filed in 2018, yet another that shows nothing really has. |
US Real Personal Income, Jan 1965 - Apr 2018(see more posts on U.S. Personal Income, )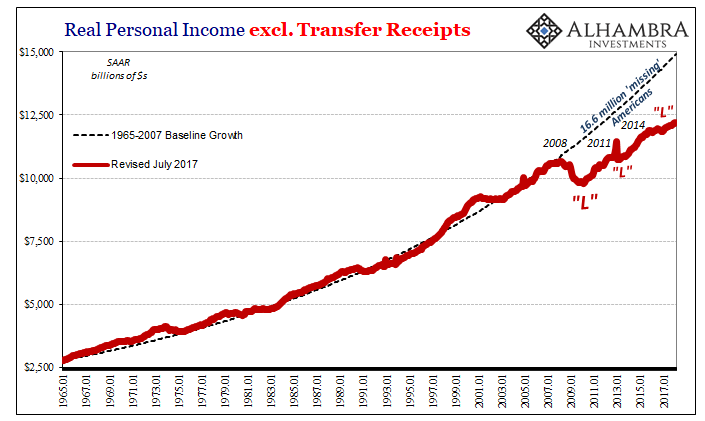 - Click to enlarge |
Tags: boom,consumer spending,currencies,economy,Featured,Federal Reserve/Monetary Policy,income,inflation,Labor Market,labor shortage,Markets,newsletter,Retail sales,U.S. Personal Income,U.S. Retail Sales,wages