For me, the defining characteristic of the late nineties wasn’t the dot-coms. Most people were exposed to the NASDAQ because, frankly, at the time there was no getting away from it. It had seeped into everything, transforming from a financial niche bleeding eventually into the entire worldwide culture. We all remember the grocery clerks who became day traders. Behind all that was some darker evolutions. It was a period where the growth in the shadows broke out in more than the quantitative. In the eighties Wall Street had lusted after the possibilities represented by the computer revolution. In the nineties, those opportunities became real enough. The first to jump on them was John Meriwether. He gathered Economic
Topics:
Jeffrey P. Snider considers the following as important: Bear Stearns, bonds, COT, COT Blue, currencies, economy, EuroDollar, Featured, Federal Reserve/Monetary Policy, Futures market, LTCM, Markets, newsletter, Shadow Banking, The United States, U.S. Treasuries, ust
This could be interesting, too:
Nachrichten Ticker - www.finanzen.ch writes Die Performance der Kryptowährungen in KW 9: Das hat sich bei Bitcoin, Ether & Co. getan
Nachrichten Ticker - www.finanzen.ch writes Wer verbirgt sich hinter der Ethereum-Technologie?
Martin Hartmann writes Eine Analyse nach den Lehren von Milton Friedman
Marc Chandler writes March 2025 Monthly
For me, the defining characteristic of the late nineties wasn’t the dot-coms. Most people were exposed to the NASDAQ because, frankly, at the time there was no getting away from it. It had seeped into everything, transforming from a financial niche bleeding eventually into the entire worldwide culture. We all remember the grocery clerks who became day traders.
Behind all that was some darker evolutions. It was a period where the growth in the shadows broke out in more than the quantitative. In the eighties Wall Street had lusted after the possibilities represented by the computer revolution. In the nineties, those opportunities became real enough.
The first to jump on them was John Meriwether. He gathered Economic titans like Robert Merton and Myron Scholes to attempt to exploit what many believed was the new way of doing things; the only way to do things in the future. They were going to trade derivatives off-balance sheet because that was the way the world was set up, and their math was the key to exploiting the opportunity (dark leverage).
LTCM blew up in September 1998. That was toward the end of the process, not the beginning. What became the Asian flu (the defining event of the era in my mind) began more than a year beforehand. There were, as always, warnings, small tremors out there in the midst of what were at the time called Asian tigers.
Though nobody was ignoring the fireworks in Thailand and Indonesia, it was their transmission to Japan in later 1997 when things really got serious. Several big Japanese trading houses went insolvent doing some of the things (in “dollars”) LTCM was doing in a big way. The DJIA even plummeted 554.26 points, or 7.18%, on October 27, 1997.
Early in 1998, the crisis only grew worse, particularly for Japan. At that year’s February FOMC meeting, American monetary officials discussed several covert transactions undertaken between them (likely via FRBNY) and the Bank of Japan as well as Japan’s Ministry of Finance. The latter two entities were badly in need of “dollar” financing.
How much? We don’t know to this day because the transcripts are full of blanks where numbers should be.
MR. FISHER We took [blank] of bills into the SOMA account, selecting bills that we would be able to run off in the course of January so as not to make our need to drain reserves any worse at the end of the month. We sold [blank] for them in the market and took another [blank] out of the repo pool, where we have had an elevated cash balance for them, to help them in effect to meet their cash needs. We also actually arranged a transaction between the Bank of Japan and the Ministry of Finance during the period; one wanted to sell bills and the other to buy.
| Peter Fisher’s recounting of the trades was preceded by this suspiciously incomplete passage: “Just before Christmas, we confronted an order from the Japanese authorities to sell in Treasury bills. In the absence of [redacted].” What was left off what are supposed to be verbatim transcriptions amounted to nearly two lines of text. In the absence of what?
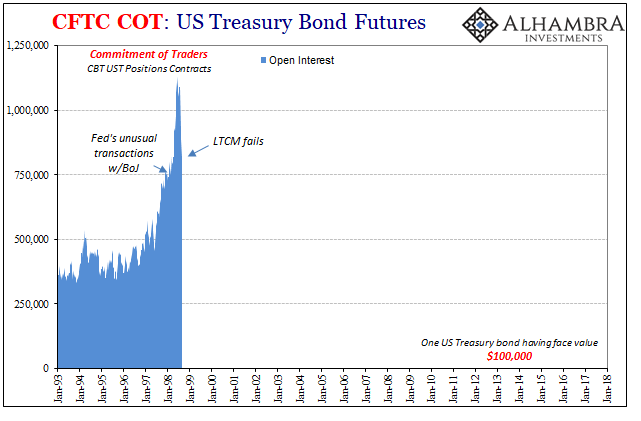
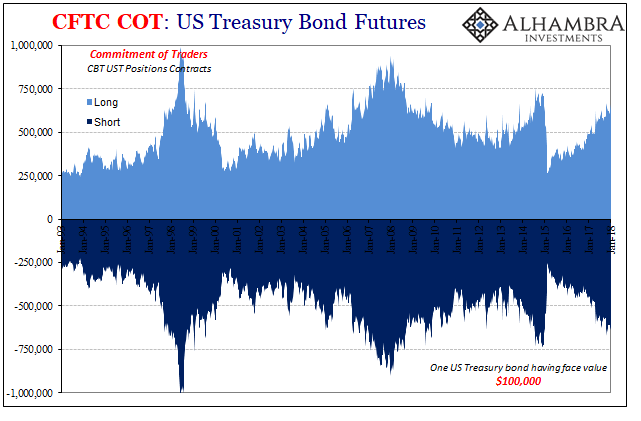
Markets weren’t waiting around for an answer. Though this was never made public, nobody needed them to be to realize that things were getting very dicey globally (just ask any Russian old enough to remember). I could go through all the ways everything became so skewed throughout 1998 up until LTCM’s final days, but I want to focus on UST futures. Treasury futures were and are with eurodollar futures the premier hedging instruments for everyone of any size and substance (including LTCM). If you are worried about something big, that’s where you go because that’s where there’s sufficient liquidity to lay off whatever risks you might perceive. And it’s what everyone was doing throughout the first two-thirds or so of 1998. |
US Treasury Bond Futures, Jan 1993 - 2018(see more posts on U.S. Treasuries, ) |
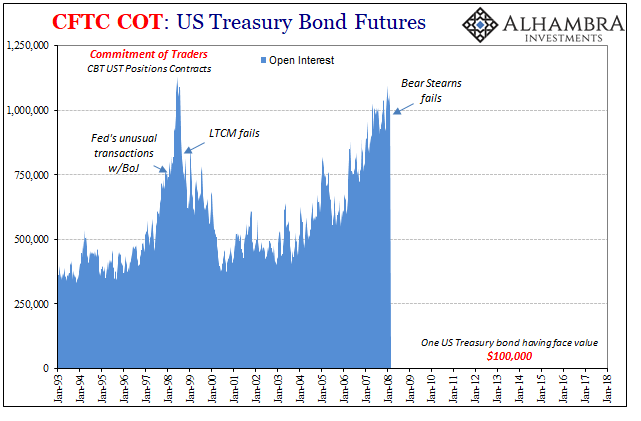
Open interest at the old Chicago Board of Trade exploded upward. It started coming down months before LTCM’s end in what appears to have been dealers pulling back their own risk capacities in light of that one firm’s further funding difficulties. It was, in a word, systemic. The FOMC was stunned to find out why in September 1998 as they were forced to get involved, if more indirectly.
Nobody did, that’s why first the jump in demand for hedging that was met by dealers – and then it wasn’t. Contagion. It’s a process we’ve seen repeat. In the months leading up to Bear Stearns’ ultimate demise, same pattern appears in the open interest for UST futures. There was huge demand for hedging against “some” great uncertainty that was at first palatable enough for dealers to take on, and then it wasn’t. |
US Treasury Bond Futures, Jan 1993 - 2018(see more posts on U.S. Treasuries, ) |
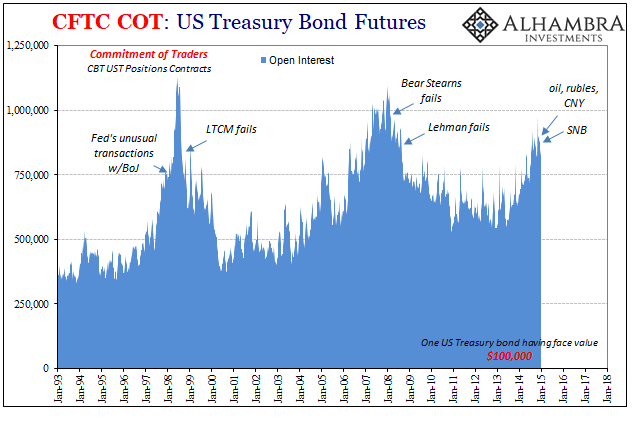
| The futures market records a third such wave of apprehension feeding hedge demand in 2014. It broke not with a famous bank failure, but a central bank one (though the SNB wasn’t alone, it was just the most prominent at that time to be pulled under by that “rising dollar”). |
US Treasury Bond Futures, Jan 1993 - 2018(see more posts on U.S. Treasuries, ) |
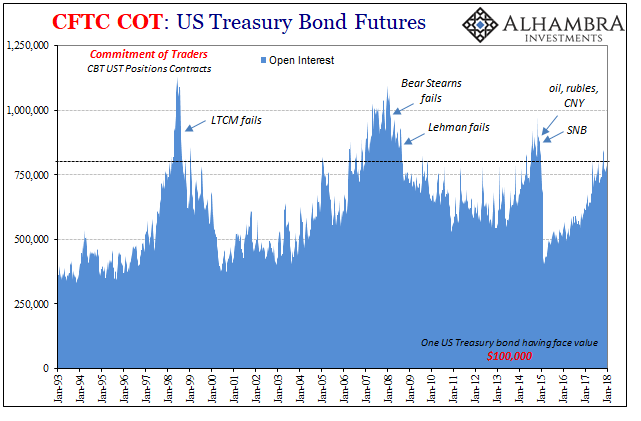
| Compared to a lot that goes on in these kinds of markets, especially where derivatives like these are concerned, this one’s pretty simple and intuitive. Open interest goes up when markets aren’t very sure about what’s in the future. Since UST’s are the settlement product for a variety of shadow trades, especially derivative FX, what’s being hedged here isn’t really UST yields or the US government’s credit risk. |
US Treasury Bond Futures, Jan 1993 - 2018(see more posts on U.S. Treasuries, ) |
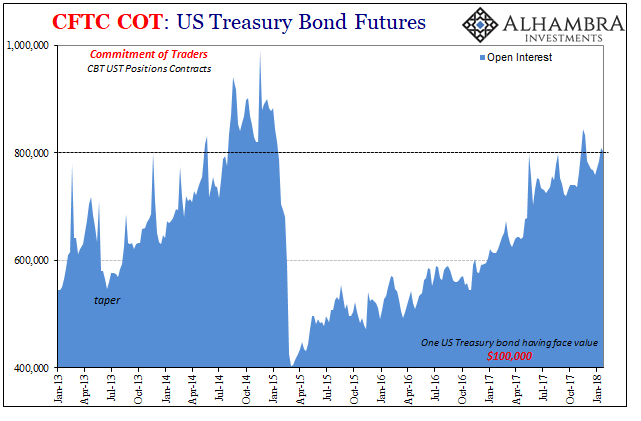
| It’s not a perfect indication by any means, but whenever open interest hits above 800,000 across the Chicago platforms it’s been in the past a sign of something.
So, what is the markets worried about right now? |
US Treasury Bond Futures, Jan 1992 - 2016(see more posts on U.S. Treasuries, ) |
| The mainstream answer is surely the Fed and its inflation forecast. People are seeing something like the 1970’s again, so hyped is every little tick in TIPS or the slightest rise in average hourly earnings (totally ignoring the vastly more instructive average weekly earnings). Jay Powell is a hawk and the bond market is about to blow up the universe.
The first problem I have with that theory is that if you went back to late 2014 and showed an Economist (or other expert) the same chart of open interest for UST futures and asked them what the market was so concerned about, you would have gotten the same answer three years ago as today. Their story never changes. The US and global economy was looking a lot better then as compared to now, and it was still close enough to the last QE’s that monetary policy seemed still a plausible reason for futures market to drive more so in worry. In other words, fear of inflation was far more grounded and valid in 2014 than 2018, and still 2015-16 didn’t end up close to being that way. These big jumps in open interest just don’t correspond with Treasury selloffs, nor a “falling dollar.” They don’t. The UST 10s had yielded near 7% in the first half of 1997 before anyone had heard of or cared about Yamaichi, and then got down to 4.16% in October 1998 after LTCM. It wouldn’t reach 6% again until June 1999 and then would only make one more run at 7% in the “rate hikes” of early 2000. In other words, rates were overall lower for all that happened, not substantially higher. The reason for that is plain; liquidity risk made real by what was going on in the shadows. The hedging demand was against “dollar” constraint and the deflationary pressures some good proportion of market participants were seeing that not everyone else was ever made aware of. |
US Treasury Bond Futures, Jan 2013 - 2018(see more posts on U.S. Treasuries, ) |
Maybe this time is different, or the open interest level is sending a false signal. Anything is possible. But it’s still worth noting the rise here and in the complete context of previous rises. It’s as bland a statistic as there might be, but there are times to take great interest in open interest.
Tags: Bear Stearns,Bonds,COT,COT Blue,currencies,economy,EuroDollar,Featured,Federal Reserve/Monetary Policy,Futures market,LTCM,Markets,newsletter,Shadow Banking,U.S. Treasuries,ust

