Swiss Franc The Euro has risen by 0.38% to 1.1502 CHF. EUR/CHF and USD/CHF, February 09(see more posts on EUR/CHF, USD/CHF, ) Source: markets.ft.com - Click to enlarge FX Rates The 100-point slide in the S&P 500 and the 1000-point drop in the Dow Jones Industrials yesterday spurred more bloodletting in Asia. The 1.8% drop in the MSCI Asia Pacific Index (for a 6.7% loss for the week) may conceal the magnitude of the regional losses. At one point the CSI 300 of the large Chinese mainland shares was off more than 6% before closing off 4.3% (and 10% for the week). The H-shares index was down 3.9% and 12% for the week. The Nikkei was off 2.3% to bring its loss for the week to 8.1%. European markets are lower, but
Topics:
Marc Chandler considers the following as important: $CNY, AUD, CAD, China Consumer Price Index, China Producer Price Index, EUR/CHF, Featured, France Industrial Production, FX Trends, Italy Industrial Production, JPY, newslettersent, Norwegian Krone, SPY, TLT, U.K. industrial production, U.K. Manufacturing Production, U.K. trade balance, USD, USD/CHF
This could be interesting, too:
Nachrichten Ticker - www.finanzen.ch writes Die Performance der Kryptowährungen in KW 9: Das hat sich bei Bitcoin, Ether & Co. getan
Nachrichten Ticker - www.finanzen.ch writes Wer verbirgt sich hinter der Ethereum-Technologie?
Marc Chandler writes March 2025 Monthly
Mark Thornton writes Is Amazon a Union-Busting Leviathan?
Swiss FrancThe Euro has risen by 0.38% to 1.1502 CHF. |
EUR/CHF and USD/CHF, February 09(see more posts on EUR/CHF, USD/CHF, )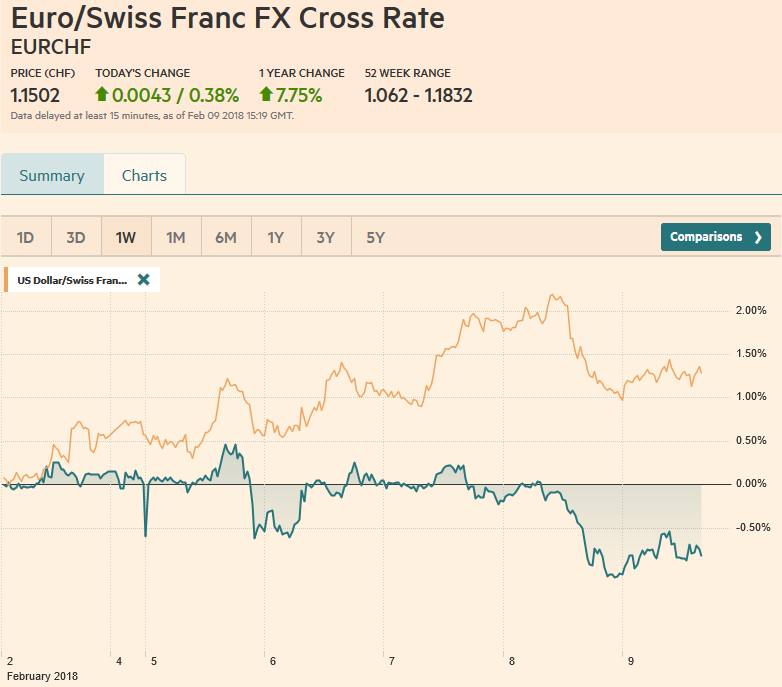 Source: markets.ft.com - Click to enlarge |
FX RatesThe 100-point slide in the S&P 500 and the 1000-point drop in the Dow Jones Industrials yesterday spurred more bloodletting in Asia. The 1.8% drop in the MSCI Asia Pacific Index (for a 6.7% loss for the week) may conceal the magnitude of the regional losses. At one point the CSI 300 of the large Chinese mainland shares was off more than 6% before closing off 4.3% (and 10% for the week). The H-shares index was down 3.9% and 12% for the week. The Nikkei was off 2.3% to bring its loss for the week to 8.1%. European markets are lower, but the losses are modest, perhaps helped by a recovery of US stocks. The S&P 500 is about 0.5% better in electronic trading. European markets are nursing 0.3%-0.4% losses. The Dow Jones Stoxx 600 is off 0.4% bringing this week’s loss to about 4%. Of note, the Italian stock market is off about 3.4% on the week and is the only G7 equity market that had managed to hold on to some gains for the year (~2.5%). |
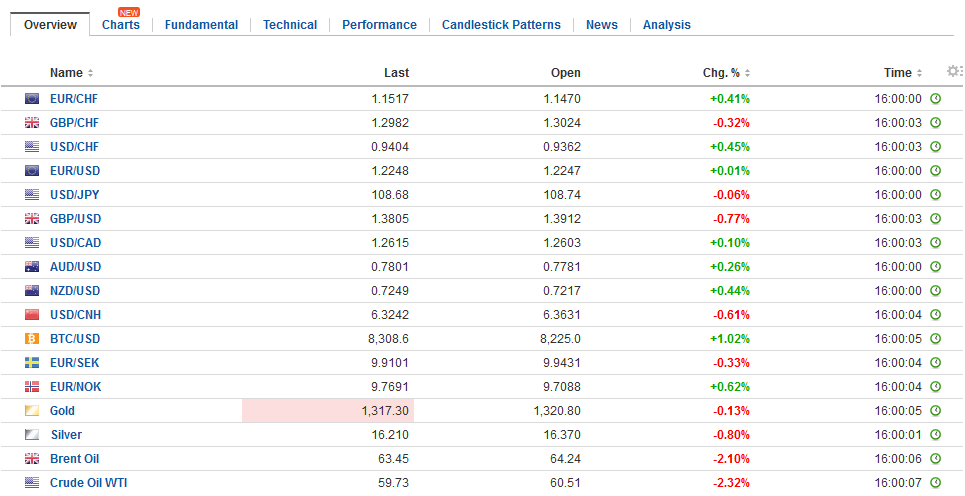
FX Daily Rates, February 09 |
| The sliding equities is not offering the bond market much support. This seems unusual. Such large declines in equities are usually associated with safe haven buying of fixed income. The generic 10-year US yield is unchanged on the week at 2.84%. The generic two-year yield is off two basis points compared with last week’s close, but is 18 bp higher than the week’s low set on Tuesday (near 1.94%). The 10-year benchmark yield in Germany is two basis point higher, while the UK benchmark is four basis points higher. The 10-year JGB was flat on the week coming into today’s session when the yield slipped 1.5 bp.
There are a few economic data points today to note. First, the Monetary Policy Statement from the Reserve Bank of Australia softened the outlook for inflation and job (though revised the unemployment forecast to 5.25% by end of June 2019 from 5.5%) by suggesting it will take longer (“some time) before its targets are reached. The key takeaway is confirmation policy is on hold. Separately, home loans for December fell 2.3%, more than twice the decline expected and the November series was revised to 1.6% from 1 2.1% gain. |
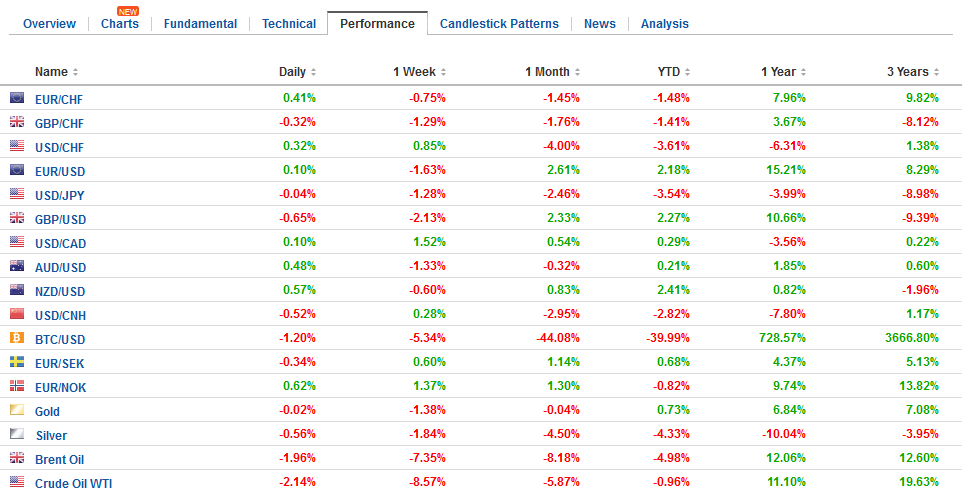
FX Performance, February 09 |
ChinaChina reported both CPI and PPI spot on forecasts. CPI rose 1.5% from a year ago in January, down from 1.8% in December. PPI slowed to 4.3% from 4.9%. Meanwhile, the PBOC set the dollar-yuan reference rate 0.59% higher at CNY6.3194., the most in a little more than a year. |
China Consumer Price Index (CPI) YoY, Jan 2018(see more posts on China Consumer Price Index, )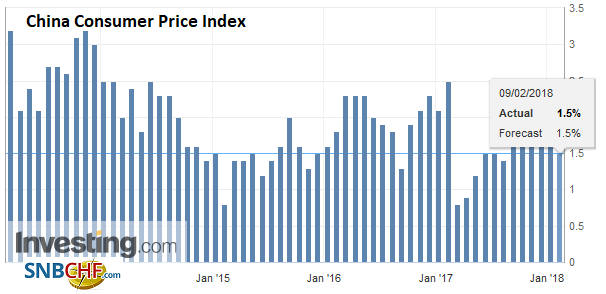 Source: Investing.com - Click to enlarge |
| However, ahead next week’s Chinese holiday for the Lunar New Year, the yuan was in demand. The dollar finished nearly 0.5% lower on the session and the yuan was essentially flat on the week, but it is the ninth week that it did not fall net-net against the dollar. |
China Producer Price Index (PPI) YoY, Jan 2018(see more posts on China Producer Price Index, )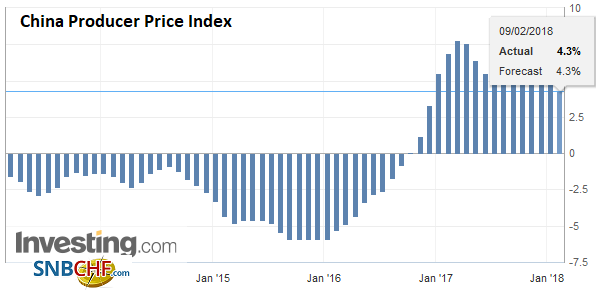 Source: Investing.com - Click to enlarge |
FranceTurning to Europe, France and Italy reported better than expected December industrial output figures. Recall than earlier this week, Germany reported a 0.6% decline in its industrial production and revised lower the strong gains in November. France was just the opposite. |
France Industrial Production, Dec 2017(see more posts on France Industrial Production, )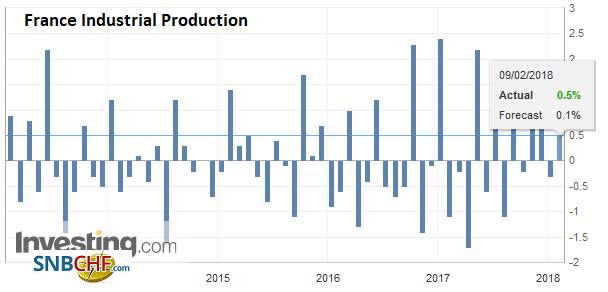 Source: Investing.com - Click to enlarge |
ItalyIndustrial output rose 0.5% in December (median forecast in the Bloomberg survey was 0.1%), and the November decline was shaved to 0.3% from 0.5%. French manufacturing rose 4.7% last year (year-over-year) in December after a 0.1% increase in 2016 and 0.9% in 2015. It is the strongest rise since 2010. |
Italy Industrial Production YoY, Dec 2017(see more posts on Italy Industrial Production, )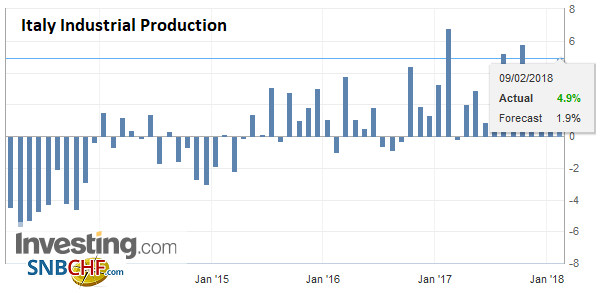 Source: Investing.com - Click to enlarge |
United KingdomThe UK reported worse than expected December industrial production figures (-1.3% on the month and flat for the year), and a considerably largest than expected trade deficit. |
U.K. Industrial Production YoY, Dec 2017(see more posts on U.K. Industrial Production, )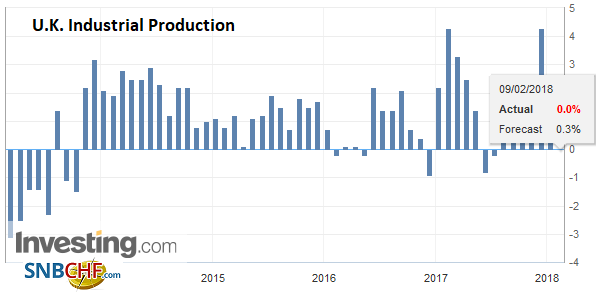 Source: Investing.com - Click to enlarge |
| That said, there were two bright spots in today’s data. First, manufacturing output fared better, rising an as expected 0.3% in the month of December (though the November gain was halved to 0.2%), and construction output jumped 1.6%, while the market was looking for a small decline. |
U.K. Manufacturing Production YoY, Dec 2017(see more posts on U.K. Manufacturing Production, )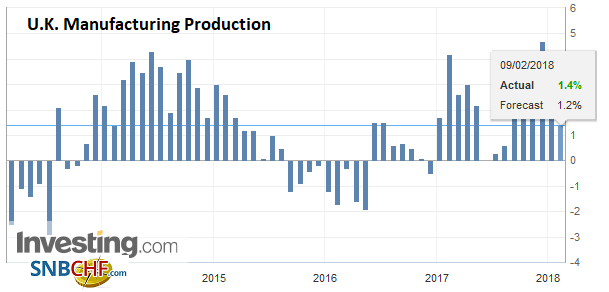 Source: Investing.com - Click to enlarge |
| The November series gain was cut to 0.1% from 0.4%. The overall trade deficit was twice what the market expected at GBP4.9 bln and the November shortfall was revised to GBP3.65 bln from GBP2.80 bln. |
U.K. Trade Balance, Dec 2017(see more posts on U.K. Trade Balance, )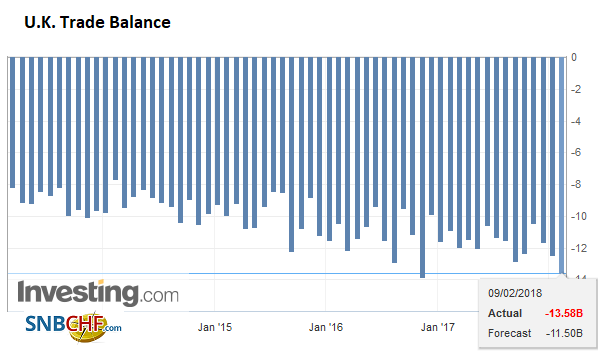 Source: Investing.com - Click to enlarge |
Not to be outdone, Italy reported a 1.6% rise in December industrial output for a 4.9% rise year-over-year, and the November report was revised slightly higher. The year-over-year increase is also the best since 2010. The better economic performance, however, does not appear to be strengthening the government’s position ahead of next month’s election. The latest polls show the center-right coalition leading and the PD, which lead the government, have slipped to third place behind the Five-Star Movement. The most likely electoral outcome still seems to be a grand coalition between the center-right led by Berlusconi and the center-left led by Renzi.
Still, the data is mostly old news and instead the hawkishness of the Bank of England shown yesterday is still very much the buzz. MPC’s Broadbent, who is thought to be among the candidate to replace Carney as Governor next year, emphasized the shifting views of the labor market as key. The strength of the global economy was also cited as a key to the BOE’s outlook. Looking at the OIS, it appears the market is discounting a nearly 2/3 chance of a hike in May, but from a little more than a 1/3 chance at the end of January.
The US economic calendar is light, with only December wholesale inventories on tap. The market will keep an eye on the debate in Congress where the spending authorization has expired but some rearguard action is needed. It is not clear, even now, whether the Senate measure will be accepted by the House. The compromise lifts the debt ceiling and would boost defense and non-defense spending by $300 bln over the next two years (which includes disaster relief). After recently approved tax cuts that by themselves would lead to a larger deficit and more debt, now some in Congress are balking at boosting spending because of the deficit impact.
Canada reports January employment data. Canada’s labor market has been particularly strong. It created on average 32.6k full-time positions a month in 2017. Given the relative size difference, it would be as if the US created 300k+ jobs a month. The labor market is expected to have cooled last month. The market looks for something closer to 10k increase in overall employment, down from 78.6k in December. The US dollar is trading at its best level this year against the Canadian dollar. The next target is near CAD1.2660.
The moves in the foreign exchange market reduces the impact of today’s option expires. The euro, for example, is trading in between the $1.22 strike (1.2 bln euros set expire) and $1.23 (~780 mln euros). Sterling, which traded as high as $1.4050 yesterday is struggled near $1.39 today. There is an option for GBP420 mln struck at $1.3950 that will be cut today. However, there is a large (~A$2.7 bln) option struck $0.7800 that is in play, and the New Zealand dollar is close it a $0.7250 strike (~NZD$200 mln).
More broadly, the US dollar is mixed today. Norway, which reported somewhat softer than expected inflation, is suffering the most. The krone is off nearly 1.3% today. The Antipodean currencies are performing the best but are up slightly. Outside of Norway and the yen (which is off 0.3%), the other major currencies are =/- 0.2%, underscoring, as we noted yesterday, the punishing spike in volatility seen in the equity markets is still quite mild in the foreign exchange market.
Graphs and additional information on Swiss Franc by the snbchf team.
Tags: #USD,$AUD,$CAD,$CNY,$JPY,$TLT,China Consumer Price Index,China Producer Price Index,EUR/CHF,Featured,France Industrial Production,Italy Industrial Production,newslettersent,Norwegian Krone,SPY,U.K. Industrial Production,U.K. Manufacturing Production,U.K. Trade Balance,USD/CHF

