This economic cycle is one of the longest on record for the US, eight years and counting since the end of the last recession. It has also been, as almost everyone knows, a fairly weak expansion, one that has managed to disappoint both bull and bear. Growth has oscillated around a 2% rate for most of the expansion, falling at times perilously close to recession while at others rising tantalizingly close to escape velocity. We never seem to be able to get beyond the event horizon of this black hole of malaise. And we got another GDP report last week that simultaneously inspired zero confidence that we are headed for something better and relief that we aren’t headed for something much worse. I think what most people
Topics:
Joseph Y. Calhoun considers the following as important: 10 year treasury yield, Alhambra Research, Bi-Weekly Economic Review, bonds, business investment, commodities, copper:gold, credit spreads, currencies, Dollar, durable goods orders, economic growth, economy, empire state manufacturing survey, Featured, GDP, Gold, House Prices, Housing Starts, inflation, Markets, New Home Sales, newslettersent, Philly Fed, The United States, TIPS, Yield Curve
This could be interesting, too:
Nachrichten Ticker - www.finanzen.ch writes Die Performance der Kryptowährungen in KW 9: Das hat sich bei Bitcoin, Ether & Co. getan
Nachrichten Ticker - www.finanzen.ch writes Wer verbirgt sich hinter der Ethereum-Technologie?
Marc Chandler writes March 2025 Monthly
Mark Thornton writes Is Amazon a Union-Busting Leviathan?
This economic cycle is one of the longest on record for the US, eight years and counting since the end of the last recession. It has also been, as almost everyone knows, a fairly weak expansion, one that has managed to disappoint both bull and bear. Growth has oscillated around a 2% rate for most of the expansion, falling at times perilously close to recession while at others rising tantalizingly close to escape velocity. We never seem to be able to get beyond the event horizon of this black hole of malaise. And we got another GDP report last week that simultaneously inspired zero confidence that we are headed for something better and relief that we aren’t headed for something much worse. I think what most people feel with this economy is just exhaustion.
It is interesting that the total change in real GDP in this cycle is not significantly different than the last one – about 18%. So, yes it has been weak but really the entire period since the turn of the century has been slow and disappointing. Maybe we didn’t feel as bad about the early ’00s expansion because it was felt more widely as house prices affected a larger slice of the population than stocks. But from purely an economic expansion standpoint this current up cycle is just a mirror of the previous one. And both periods compare very unfavorably to the previous two cycles that expanded real GDP by roughly 40%. From a growth standpoint this period is much more like the 1970s; real GDP grew by a little over 20% from 1975 to 1980. I think there are good reasons for that but I’ll have to explore that in a separate, longer note.
Q2 GDP grew at an annualized pace of 2.6% quarter to quarter. The year over year change was 2.1%, pretty much what we’ve come to expect. The biggest change from the even more disappointing Q1 was a halving of the inflation factor from 2% to 1%. Growth was driven by durables spending up 6.3% and business investment up 5.2%. That was offset by a 6.8% drop in residential investment. As has so often been the case in this period, one part of the economy wanes as another waxes and we end up right at the same disappointing growth rate of 2%. You can read Jeff Snider’s in depth report on GDP here. Needless to say, we aren’t very impressed with this rebound.
The rest of the reports of the last two weeks show the same zig-zag pattern. The Empire State and Philly Fed reports were both less than expected, still pretty positive but moderating with the recent high readings never spilling over to the hard data. Housing starts provided a big upside surprise but new home sales were a bit disappointing and both are very volatile and subject to big revisions. Existing home sales were less than expected and barely positive year over year while prices are rising at 6-7% year over year depending on which report you prefer. And prices appear to be getting to levels that are now suppressing new household formation again so that isn’t a positive.
One notable positive report was durable goods orders. Yes, the headline big number was mostly about Boeing orders at the Paris airshow but orders ex-transportation were up 6.8% year over year and core capital goods orders were up 5.6% year over year and those aren’t terrible numbers. They aren’t great, as Jeff points out here, but they aren’t recession numbers either.
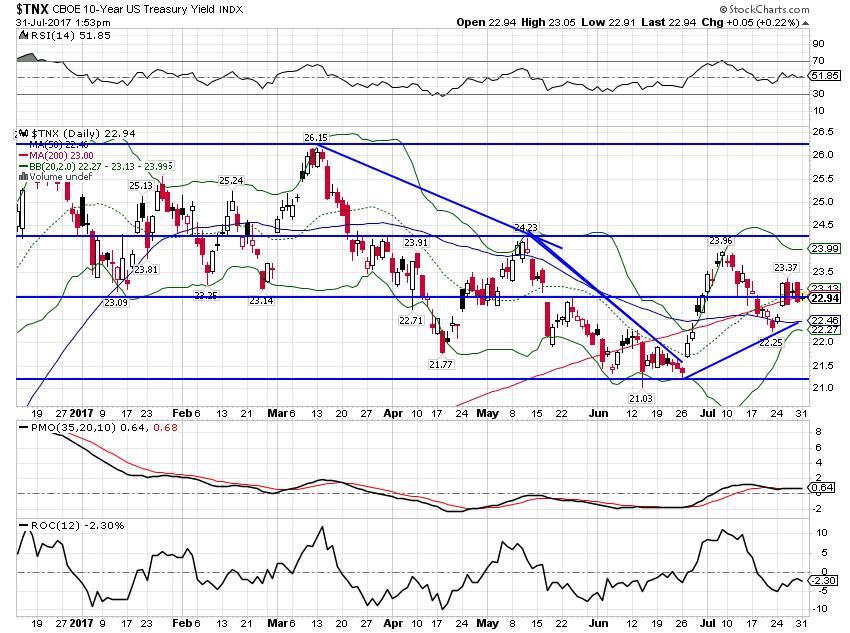
| Our market based indicators reflect this confusing environment with some showing improvement and others just continuing to show stagnant expectations. The 10 year Treasury note yield changed by all of 3 basis points: |
US 10 year Treasury Yield, Dec 2016 - Jul 2017(see more posts on U.S. Treasuries, ) |
| The yield curve managed to move even less, changing by just 2 basis points since the last update: |
US 10 Year Treasury Constant Maturity minus 2 Year Treasury, 1990 - 2017(see more posts on U.S. Treasuries, ) |
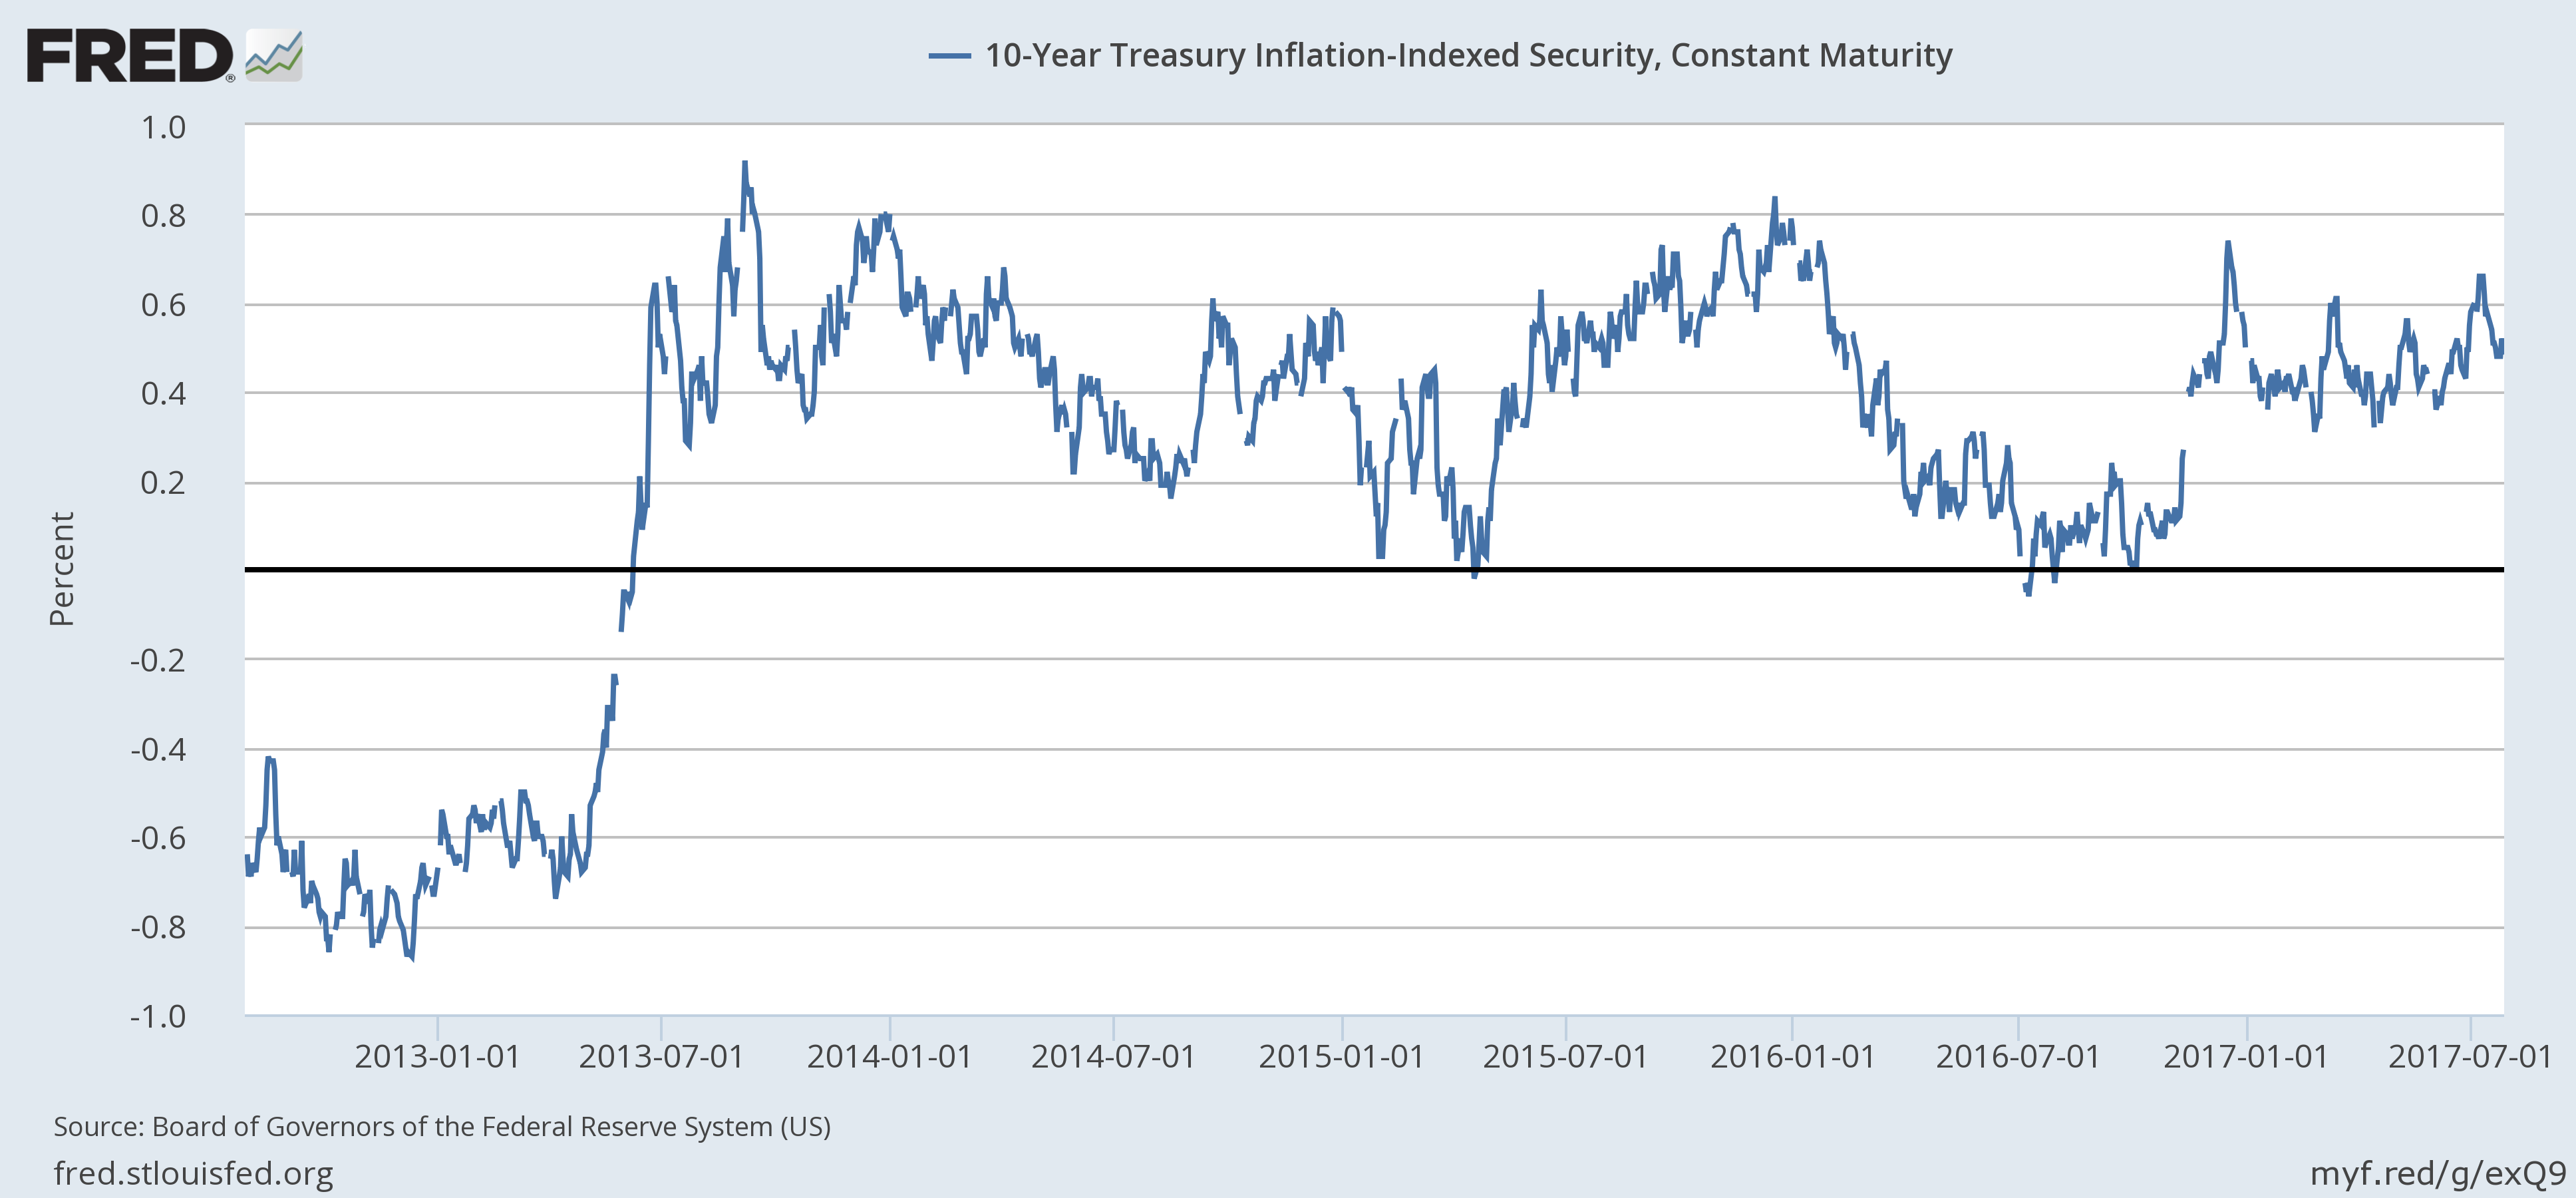
| The 10 year TIPS yield was a veritable screamer, moving 8 basis points lower, reflecting mostly the weak data reported near the end of the period: |
US 10 Year Treasury Inflation-Indexed Security, Jan 2012 - Jul 2017(see more posts on U.S. Treasuries, ) |
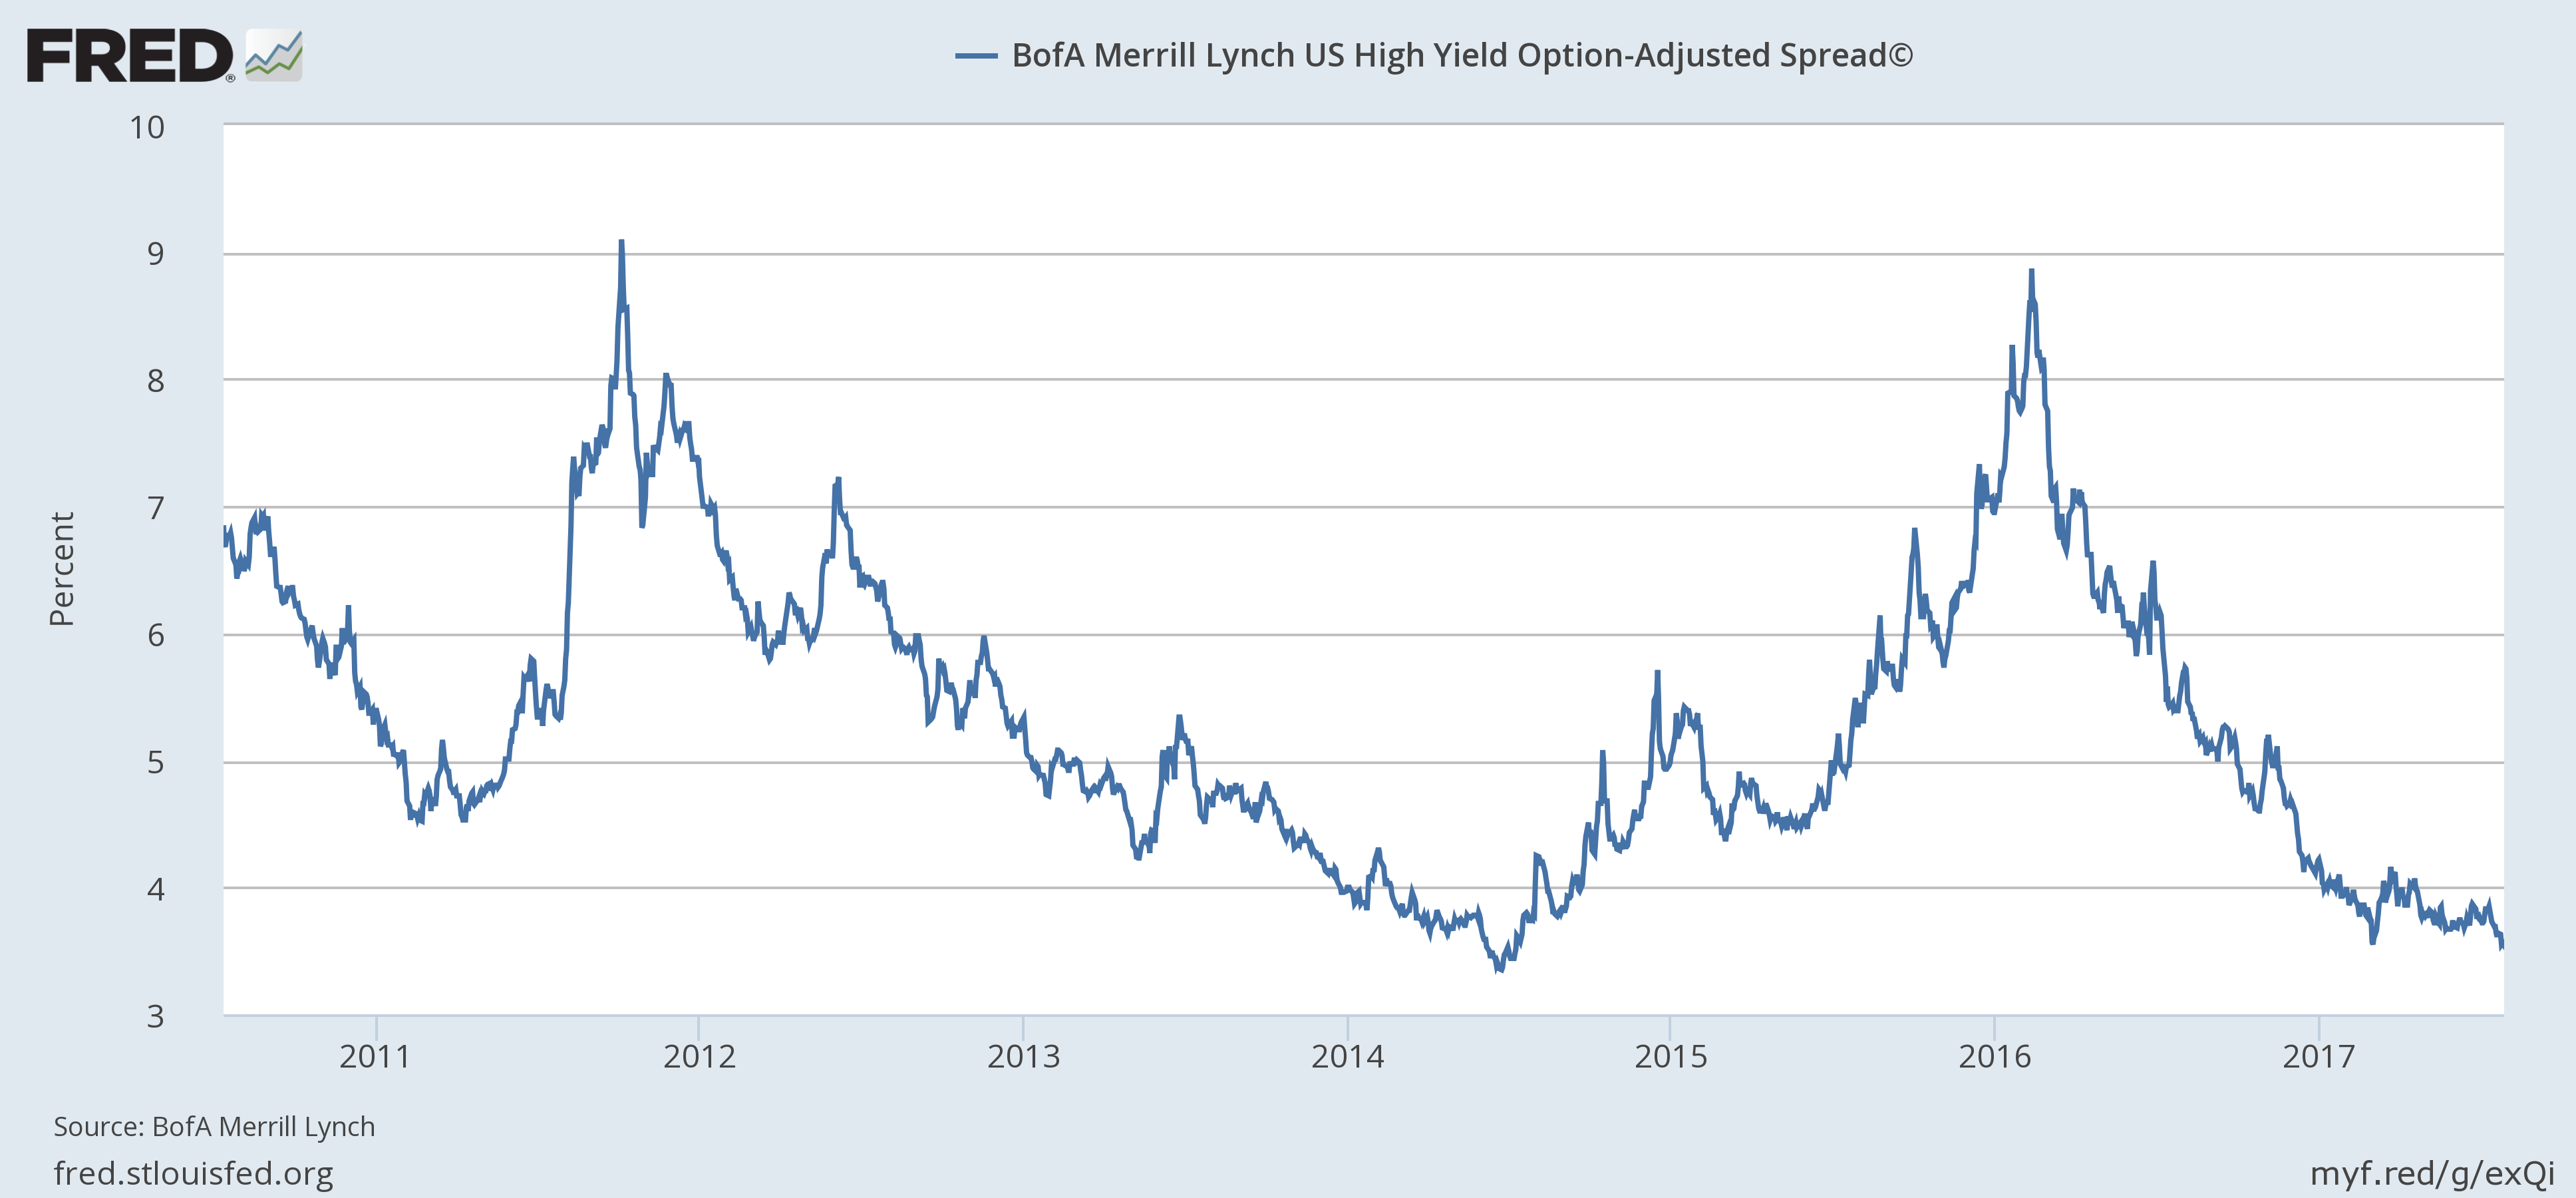
| One thing that hasn’t changed is the appetite for risk. I have to admit I’m a little surprised that the high yield bond bid actually ramped higher over the last two weeks. Spreads are now nearing cycle lows and junk bonds are making new highs. |
BofA Merril Lynch US High Yield Option-Adjusted Spread, Jul 2010 - Jan 2017 |
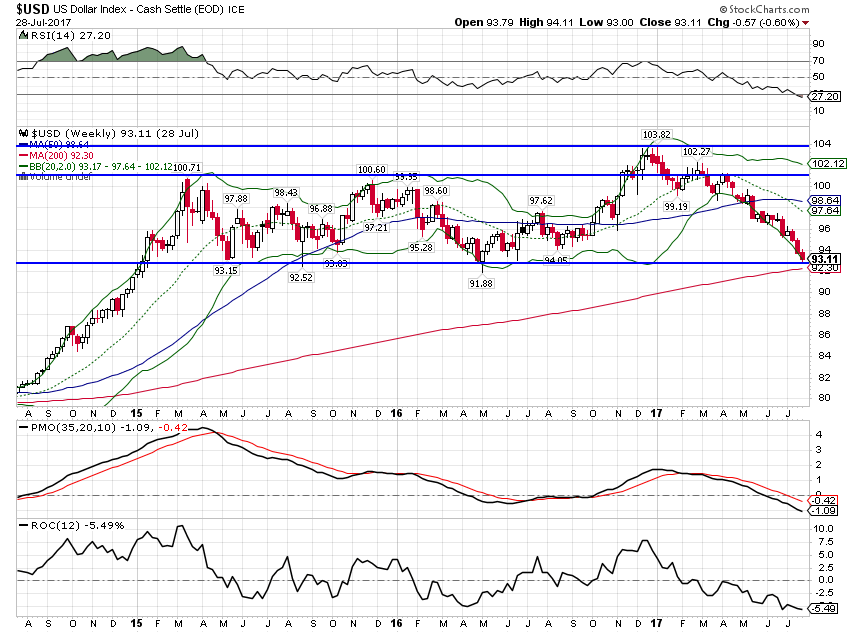
| Another thing that hasn’t changed is the relentless selling of the dollar. As I’ve said several times recently we are very near long term support for the dollar index and a bounce should be expected. That doesn’t mean we’re going to get it right now though as it is |
US Dollar Index(see more posts on U.S. Dollar Index, ) |
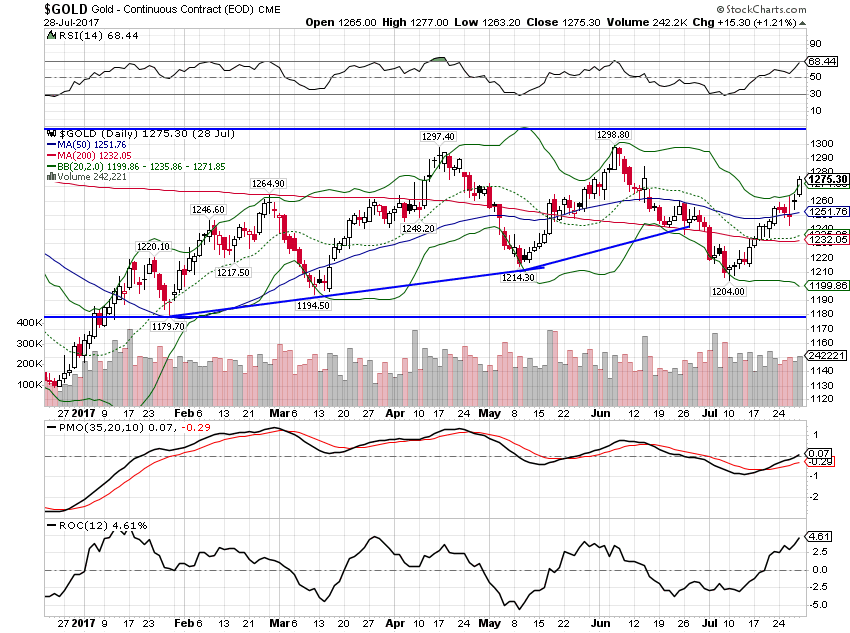
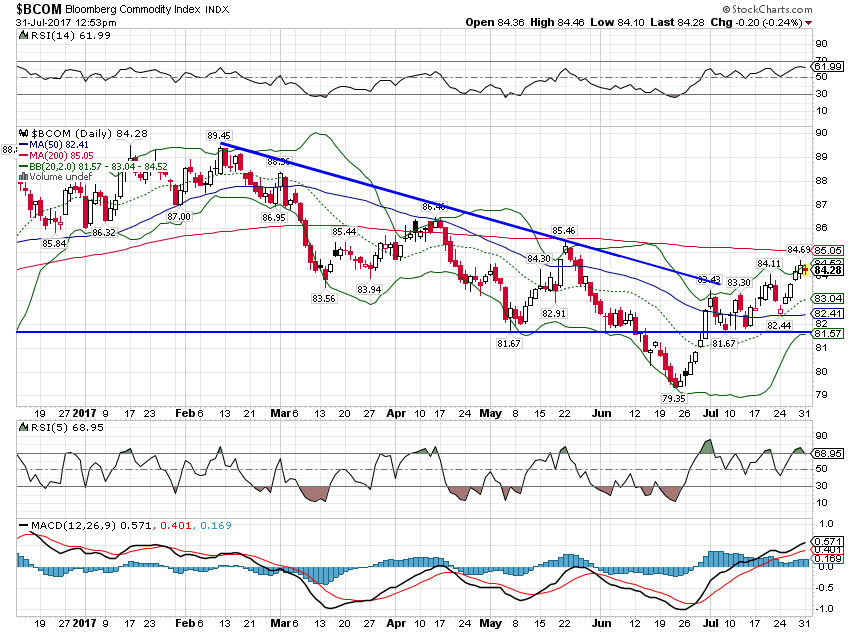
| The drop in the dollar finally picked up gold and other commodity prices as well. Gold though is still stuck in its recent range and I have my doubts about it breaking out unless the dollar really does fall off that cliff. |
Gold, Daily, Dec 2016 - July 2017(see more posts on Gold, ) |
| The BCOM looks like it is tracing out an inverted head and shoulders pattern if you put much stock in such things: |
Bloomberg Commodity Index, Dec 2016 - Jul 2017 |
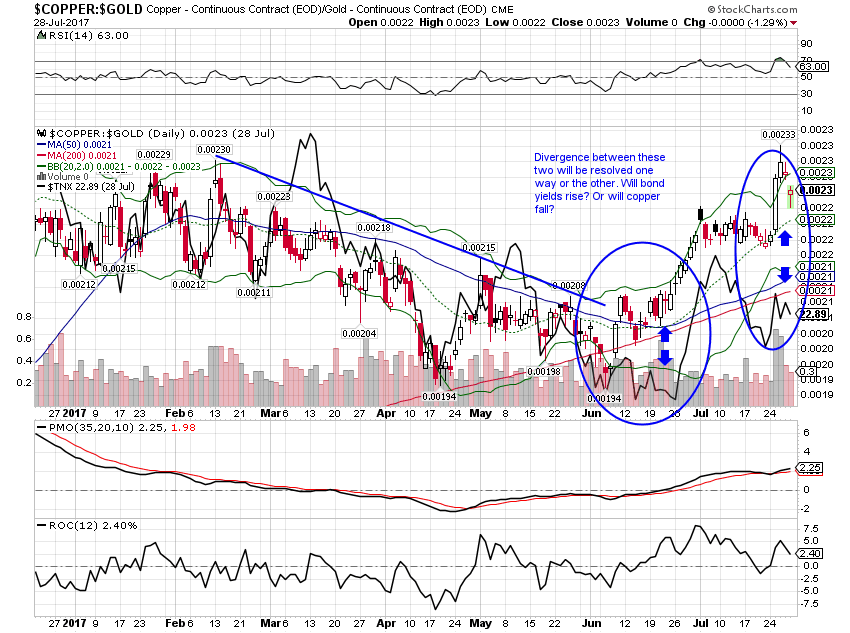
| The rise in commodity prices though is not just about the dollar. The copper:gold ratio has recently been jumping and while it hasn’t really been confirmed yet by the bond market, that is usually a pretty good indicator of growth expectations. The divergence between this ratio and the 10 year Treasury note will eventually be resolved but until we know how it doesn’t mean much. We always want to see confirming signals and bonds just aren’t there yet: |
Copper and Gold Continuous Contract, Dec 2016 - Jul 2017 |
I’ve been thinking since last year that if the dollar pulled back, this cycle might well extend much further than anyone would expect. There were a lot of reasons to think the dollar was due for a fall – sentiment mostly but cyclical reasons too – and that is exactly what we’ve gotten. Now, don’t get panicky on me. I’m not suggesting we can devalue our way to prosperity. I’m actually much more in the camp that believes we should have a strong and stable dollar – with the emphasis on stable. But since the more globalized nature of finance emerged in the 90s (well actually, if you read Jeff you know it started much earlier; it just hit critical mass in the 90s) I’ve spent a good portion of my time monitoring capital flows and the currencies and economies they affect. There is a certain amount of reflexivity here as capital is attracted to growth and growth responds favorably to more capital.
What we have right now is a cyclical rebound in non-US economies in Europe, Latin America and Asia that is attracting capital. And that capital inflow (reflected in that ski slope dollar chart above) will have its own impact on growth and inflation that could, if it continues, push those economies beyond mere cyclical upturn. If the US can avoid recession – and we are so far – as those economies pick up then foreign markets will likely continue to outperform our own. But it will also have a positive impact on US multi-nationals – as we’re seeing in this earnings season – as non-dollar earnings improve. You’ll probably still make more owning non-dollar denominated instruments as you’ll make money on the currency as well but you also add the risk of a currency reversal. And that is at the top of my worries right now.
The US economy and more widely the global economy is stuck in a weak growth environment. I won’t speculate in this post about why that is so beyond saying I think a big part of the cause is monetary and the debt it has encouraged. For investors the why isn’t all that important unless policymakers actually propose and enact something that will end it. And we haven’t seen anything close to that since we flipped the calendar to a 2 handle so we probably need to keep figuring out ways to navigate the cycle we have rather than the one we want or think we deserve.
This cycle, more than previous ones, has been one of cycles within cycles and it has been very difficult for asset allocators. If you don’t believe that, take a look sometime at the returns generated by the global macro hedge fund crowd. These guys are not a dumb lot but you sure couldn’t tell that by their numbers. About the only thing that has worked consistently is large cap US growth stocks. Why that particular asset class has worked so well I don’t know for sure, but if I had to guess I’d start with ETFs and indexing more generally. But that doesn’t really matter much either; most people can’t just put their life savings in the S&P 500. They need bonds and other assets to reduce risk so diversification isn’t an optional part of the strategy. You have to figure out what to do with the part of the portfolio that isn’t big and US. For now, anything that is negatively correlated with the dollar is what’s working. How long? I don’t know; we’ll get a bounce somewhere. But as I sit here writing this in the lobby of the Oakbrook, IL Hilton, I see that President Trump has just fired his communications director who lasted all of about a week. Chaos in the executive branch is not usually a bullish sign for the greenback.
Tags: 10 year treasury yield,Alhambra Research,Bi-Weekly Economic Review,Bonds,business investment,commodities,copper:gold,credit spreads,currencies,dollar,durable goods orders,economic growth,economy,empire state manufacturing survey,Featured,GDP,Gold,House Prices,Housing Starts,inflation,Markets,New Home Sales,newslettersent,Philly Fed,TIPS,Yield Curve


