Industrial Production disappointed in the US last month, dragged down by auto production. Despite the return of an oil sector tailwind, IP was up just 2.2% year-over-year in July 2017 according to Federal Reserve statistics. It marks the fourth consecutive month stuck around 2% growth. The lack of further acceleration is unusual in the historical context, especially following an extended period of contraction. This rebound from the near-recession in 2015-16 has underperformed even the recovery from the dot-com recession. It was during that earlier time when so much manufacturing left the United States under the auspices of “free trade”, meaning free flow of “dollars.” For IP to come underneath that meek upturn
Topics:
Jeffrey P. Snider considers the following as important: Auto Sales, automobiles, capacity utilization, Crude Oil, currencies, economy, Featured, Federal Reserve/Monetary Policy, industrial production, Inventory, manufacturing, Markets, Mining, Motor Vehicle Assemblies, newsletter, oil and gas, The United States, U.S. Industrial Production, U.S. Motor Vehicle Assemblies
This could be interesting, too:
Nachrichten Ticker - www.finanzen.ch writes Die Performance der Kryptowährungen in KW 9: Das hat sich bei Bitcoin, Ether & Co. getan
Nachrichten Ticker - www.finanzen.ch writes Wer verbirgt sich hinter der Ethereum-Technologie?
Martin Hartmann writes Eine Analyse nach den Lehren von Milton Friedman
Marc Chandler writes March 2025 Monthly
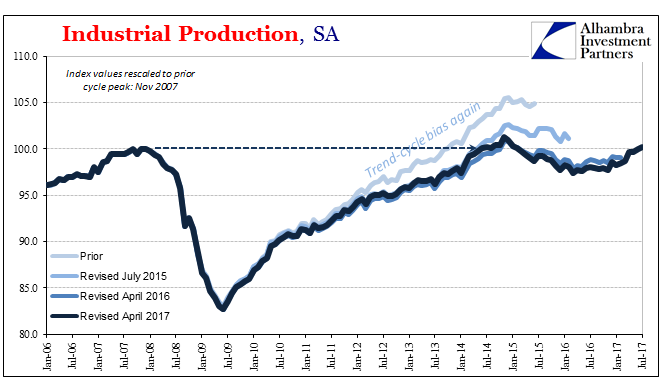
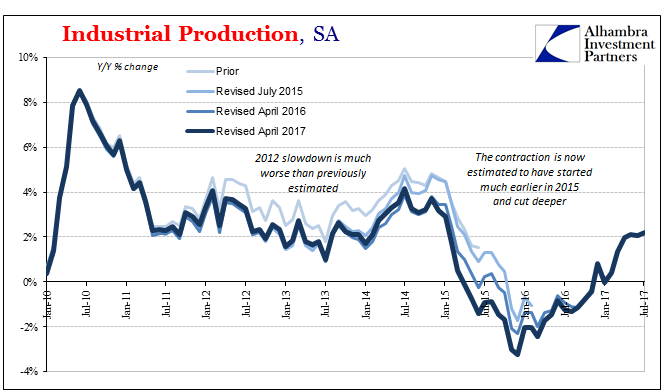
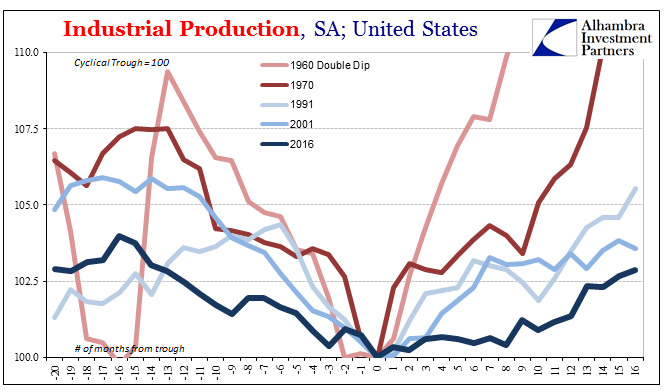
| Industrial Production disappointed in the US last month, dragged down by auto production. Despite the return of an oil sector tailwind, IP was up just 2.2% year-over-year in July 2017 according to Federal Reserve statistics. It marks the fourth consecutive month stuck around 2% growth. The lack of further acceleration is unusual in the historical context, especially following an extended period of contraction.
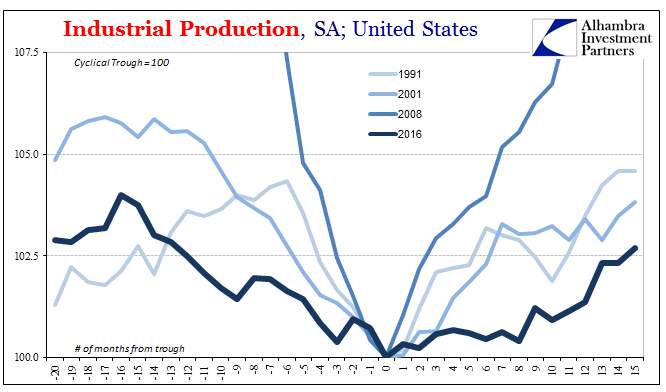
This rebound from the near-recession in 2015-16 has underperformed even the recovery from the dot-com recession. It was during that earlier time when so much manufacturing left the United States under the auspices of “free trade”, meaning free flow of “dollars.” For IP to come underneath that meek upturn really highlights the weak picture for American industry. |
US Industrial Production, Jan 2006 - Jul 2017(see more posts on U.S. Industrial Production, ) |
US Industrial Production, Jan 2010 - Jul 2017(see more posts on U.S. Industrial Production, ) |
|
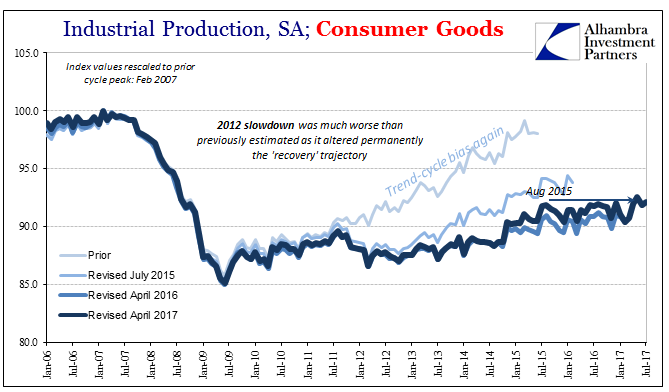
US Industrial Production and Consumer Goods, Jan 2006 - Jul 2017(see more posts on consumer goods, U.S. Industrial Production, ) |
|
US Industrial Production, 1991 - 2016(see more posts on U.S. Industrial Production, ) |
|
US Industrial Production, 1960 - 2016(see more posts on U.S. Industrial Production, ) |
|
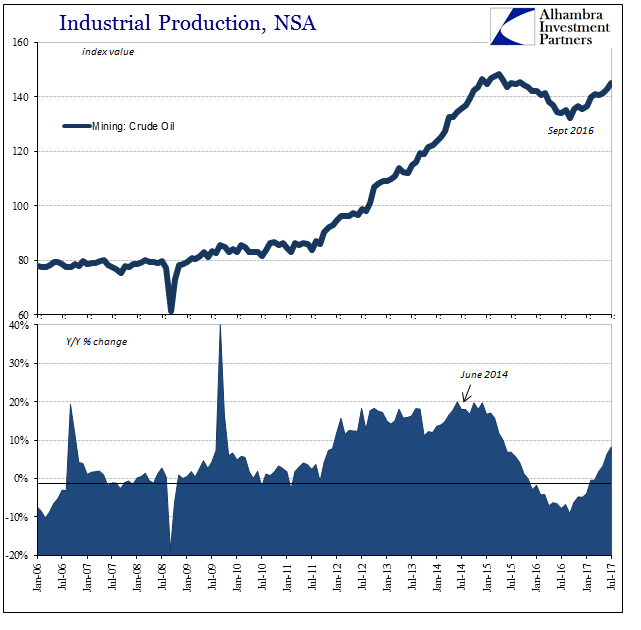
| Oil and gas production has continued higher, having turned positive last autumn. Year-over-year crude production is now up more than 8% and moving marginally closer to the growth experienced during the 2012-15 shale boom. |
US Industrial Production, Jan 2006 - Jul 2017(see more posts on U.S. Industrial Production, ) |
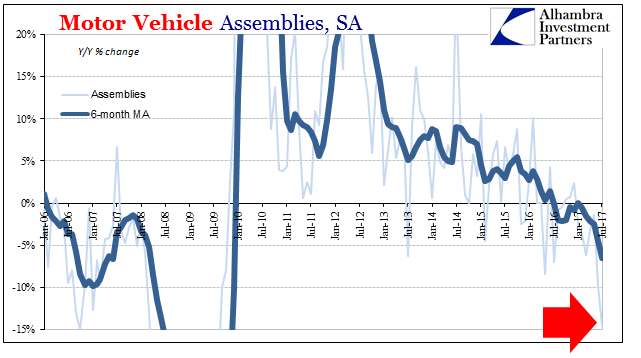
| Auto production, on the other hand, declined substantially. The Fed estimates that the total number of Motor Vehicle Assemblies, the IP subcomponent proxy for domestic automobile manufacturing, was in July just 10.2 million (SAAR). That was the first month at production volumes less than 11 million since the Polar Vortex of 2014, and the lowest figure since the taper drama of July 2013. |
US Motor Vehicle Assemblies, Jan 2006 - Jul 2017(see more posts on U.S. Motor Vehicle Assemblies, ) |
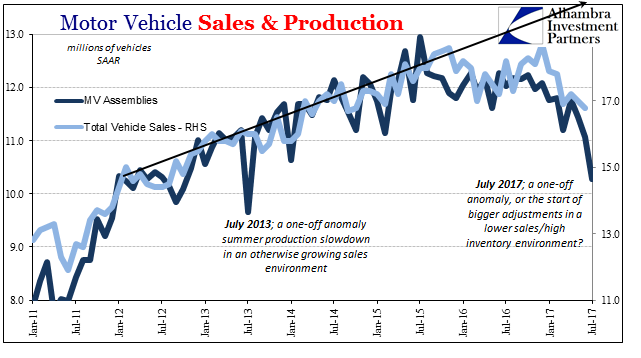
| Year-over-year, MV Assemblies were down a serious 14.5%, a level of contraction not seen since the dismal summer of 2009. This part of the IP series is subject to often significant revisions and monthly production levels can vary by considerable amounts, so it remains to be seen whether this is an anomaly of statistics or even production. Assemblies in July 2013 fell precipitously especially compared to sales, but only for that one month.
The difference this year, obviously, is both the trajectory of sales as well as a serious inventory imbalance that hasn’t been resolved by minor production adjustments. We’ve been expecting for some time the next phase in what is really a cyclical process, and for July at least the usual summer slowdown in the auto sector was far more extensive. We also have to consider the huge discounts being offered on product, as that can never be more than a temporary hit to manufacturers before they start scaling back the manufacturing side. Whether it continues will depend on what effects these cuts have on inventory. If sales incentives barely kept sales at a minimal downtrend, then their removal or even just diminishing offers might bend the trajectory that much further downward. That would mean less of an impact on inventory from lower production, triggering further re-assessment of sales incentives and production levels (in the normal cyclical fashion). |
US Motor Vehicle Sales and Production, Jan 2011 - Jul 2017 |
| The real problem in macro terms is what effect this could have, should it continue or even worsen, on the rest of the manufacturing economy. The downturn in 2015-16 occurred despite a rather robust auto sector; now being a year out from that “manufacturing recession” overall, could it be such a drag on the overall economy in still a weakened state (lack of momentum) to precipitate the formation of another downturn so soon after the last one?
The auto sector isn’t nearly as important and crucial to growth as it used to be (witness none other than the 2015-16 downturn), but it remains a large segment of US industry. Thinking recession or the like is right now getting too far ahead. For the time being, the most that might be reasonably assumed is that this serious economic drag is likely to continue for some time if to some unknown degree. The downturn as far as autos is already nine months old and inventories are still as bloated as ever, and record sales incentives could not change that. |
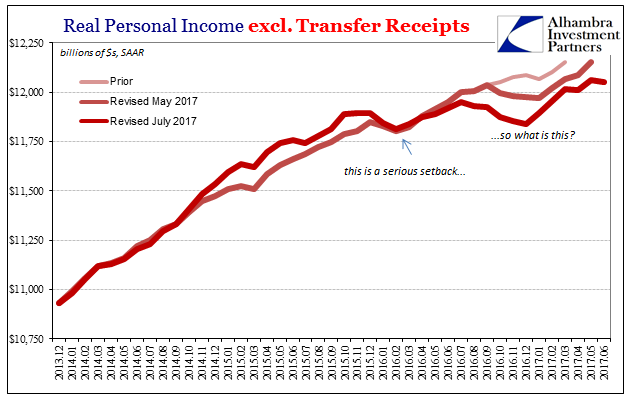
US Real Personal Income, Dec 2013 - Jul 2017(see more posts on U.S. Personal Income, ) |
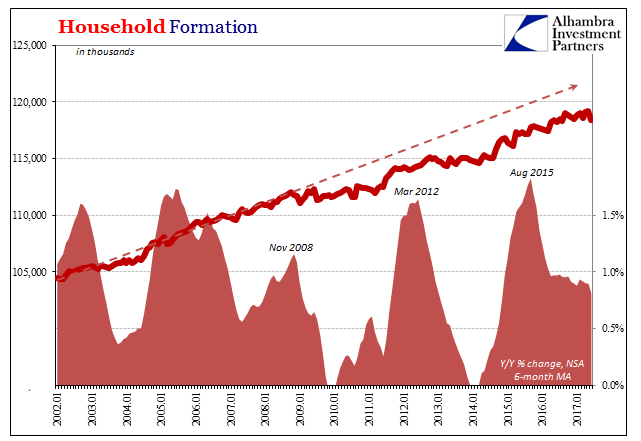
| While the Fed is trying hard to figure out its inflation/wage, bond market, and potential economy conundrums, this is another actual headwind that they don’t need. Like housing, however, the issue is likely very simple. The near-recession of the “rising dollar” really did disturb the labor market (negatively, not positively as the unemployment rate might otherwise indicate), therefore incomes, and finally at first big ticket spending like autos and shelter (including rent, meaning moving out on your own). |
US Household Formation, Jan 2002 - Jul 2017(see more posts on U.S. Household Debt, ) |
| Even a small disturbance in income statistically speaking can have larger, amplified effects as perceptions of opportunity as well as economic climate. There is a reason why economists spend so much time trying to influence expectations and emotions, if in an artificial, fake sort of way (like the various surveys of consumer sentiment that are at highs not seen in decades). Underneath all that cosmetic gloss, it seems as if the negative undercurrents of the real economy are being acted out in greater caution as well as in more direct ways (like income).
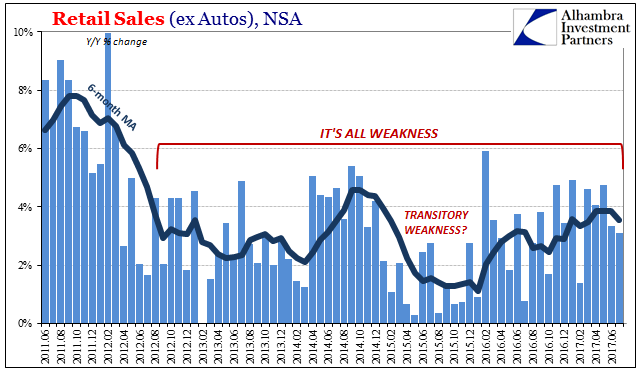
It appears to be an almost exact repeat of what happened following the 2012 near-recession. Rather than rebound in any appreciable way, the economy lingered on in a weakened state absent any momentum. It was described very differently, especially by 2014, but in truth there was little power behind the relative improvement. Characterized instead by more industries and economic sectors moving to the downside than those moving to any real upside, the 2012 slowdown was not really recession-like as it was fewer economic parts contributing to forward growth after it than before it – an engine firing on fewer cylinders. I believe that is why we are seeing in some cases the economy of 2017 fall short of comparisons to 2014 (retail sales most prominently). Every time the economy goes through one of these events, monetary events all, it comes out that much weaker for it (including globally; in 2012, the global economy lost European contributions to the “recovery”; in 2015, China and EM’s). It seems as if we might be adding the domestic auto sector to that part of the list now, too. What that means isn’t yet clear, but you can be assured it won’t mean strong or robust growth anytime soon. |
US Retail Sales, Jun 2011 - Jul 2017(see more posts on U.S. Retail Sales, ) |
Tags: Auto Sales,automobiles,capacity utilization,Crude Oil,currencies,economy,Featured,Federal Reserve/Monetary Policy,industrial production,Inventory,manufacturing,Markets,Mining,Motor Vehicle Assemblies,newsletter,oil and gas,U.S. Industrial Production,U.S. Motor Vehicle Assemblies

