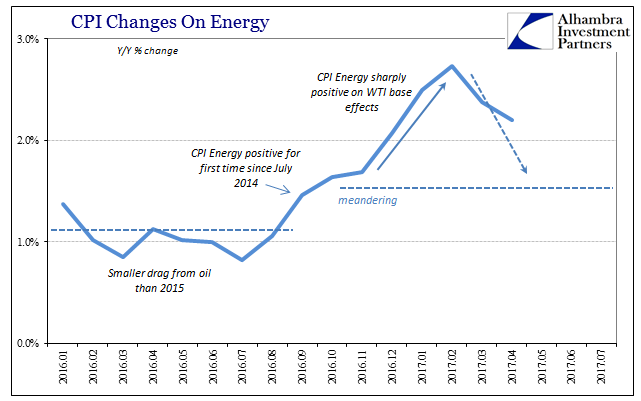
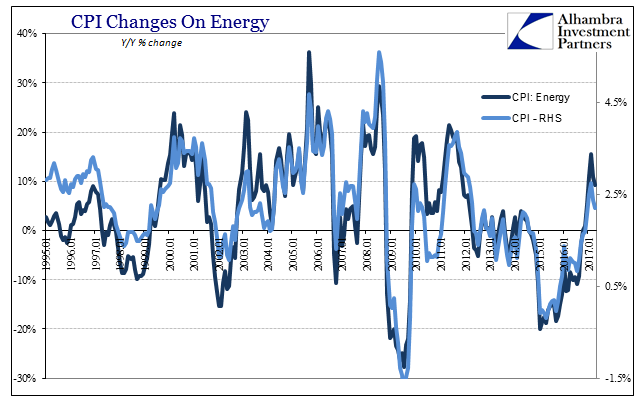
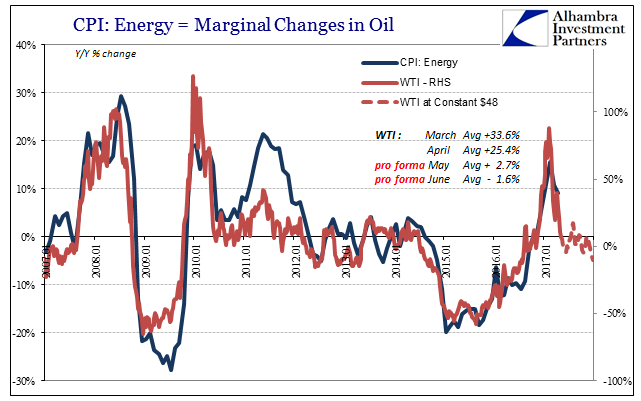
The average annual change in the WTI benchmark price was in April about 25%. That was still a sizable increase year-over-year, and just marginally less than March’s average of 33%. For calculated inflation rates, it represents the last of the base effects that have to this point made it appear as if economic improvement was possibly serious. CPI Changes On Energy, January 2016 - May 2017 - Click to enlarge Combined with the Fed’s practical monetary policy of saying very little about it and the relationship with the federal funds rate (there isn’t one), the US economy might seem to have more going for it than it truly does. CPI Changes On Energy, January 1995 - May 2017 - Click to enlarge Unless oil prices skyrocket in the next few days, the average year-over-year gain for WTI will be for May something like 3%. Since the US CPI is dependent on oil prices, just as other inflation measures all over the world are, that means next month is in all likelihood back below 2% again. The current estimate released today for April 2017 was +2.2%, the second straight month of deceleration matching closely the shape of WTI changes.
Topics:
Jeffrey P. Snider considers the following as important: Consumer Prices, Consumer Sentiment, CPI, Crude Oil, currencies, depression, economy, energy prices, Featured, Federal Reserve/Monetary Policy, inflation, inflation expectations, Markets, newsletter, oil prices, QE, rising dollar, survey of consumers, The United States, University Of Michigan, uofm, WTI
This could be interesting, too:
Nachrichten Ticker - www.finanzen.ch writes Die Performance der Kryptowährungen in KW 9: Das hat sich bei Bitcoin, Ether & Co. getan
Nachrichten Ticker - www.finanzen.ch writes Wer verbirgt sich hinter der Ethereum-Technologie?
Martin Hartmann writes Eine Analyse nach den Lehren von Milton Friedman
Marc Chandler writes March 2025 Monthly
| The average annual change in the WTI benchmark price was in April about 25%. That was still a sizable increase year-over-year, and just marginally less than March’s average of 33%. For calculated inflation rates, it represents the last of the base effects that have to this point made it appear as if economic improvement was possibly serious. |
CPI Changes On Energy, January 2016 - May 2017 |
| Combined with the Fed’s practical monetary policy of saying very little about it and the relationship with the federal funds rate (there isn’t one), the US economy might seem to have more going for it than it truly does. |
CPI Changes On Energy, January 1995 - May 2017 |
| Unless oil prices skyrocket in the next few days, the average year-over-year gain for WTI will be for May something like 3%. Since the US CPI is dependent on oil prices, just as other inflation measures all over the world are, that means next month is in all likelihood back below 2% again. The current estimate released today for April 2017 was +2.2%, the second straight month of deceleration matching closely the shape of WTI changes. |
CPI Marginal Changes In Oil, January 2007 - May 2017 |
| The Energy component of the CPI was like the oil benchmark price up just a little less in this latest month (+9.2%) than the month before (+10.9%). |
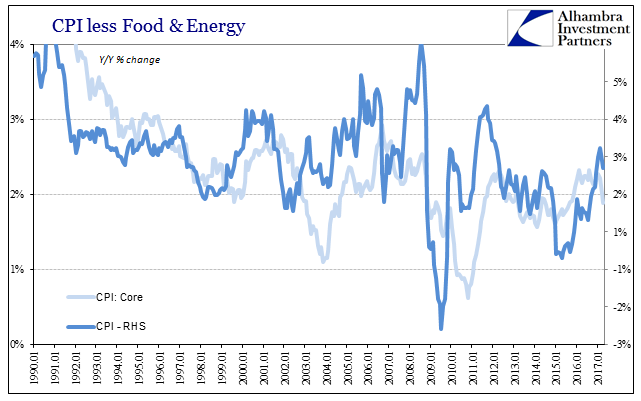
CPI Food And Energy, January 1990 - May 2017 |
| Just eyeballing the charts above, we achieve an expectation for: WTI of close to 0%, therefore CPI: Energy very slightly negative; that level for the energy portion suggests a headline CPI of about 1.6% around June. That may even end up being on the high side given that the rest of the CPI report suggests less momentum elsewhere in the various details. |
CPI Food And Energy, January 1990 - May 2017 |
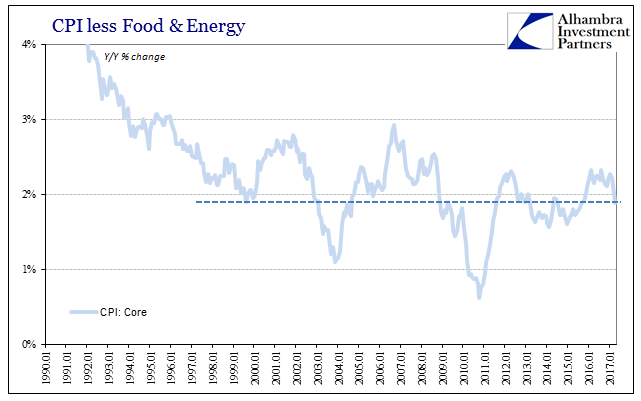
| The core CPI, prices less food and energy, dropped below 2% in April for the first time in eighteen months going back to October 2015.
If you take away the increase in shelter prices, the core inflation rate slumped to its lowest level in more than two years (February 2015), among the lowest in the whole data series. |
University Of Michigan Surveys Of Consumers, January 1997 - May 2017 |
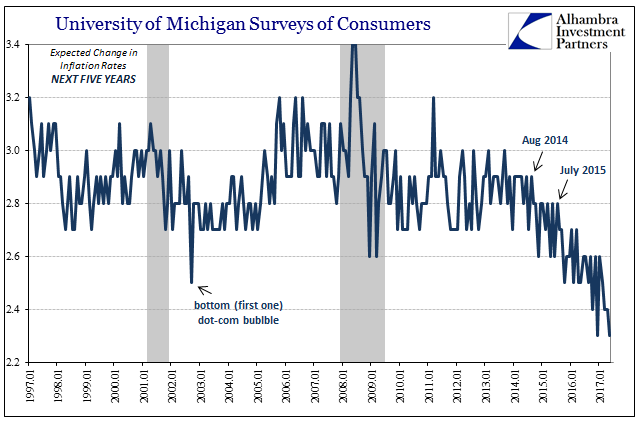
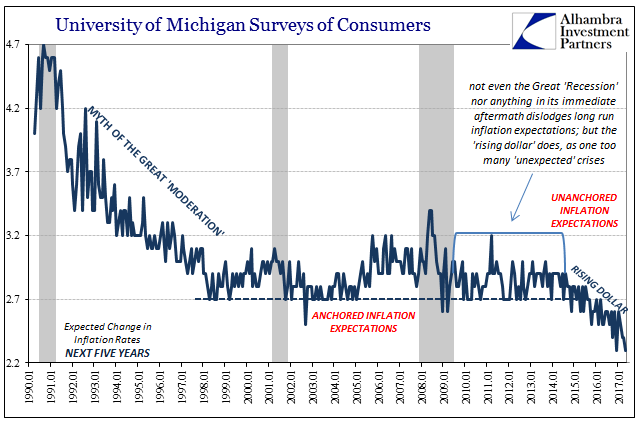
| As such, it was no surprise that the University of Michigan’s Surveys of Consumers repeated the record low in their long-term inflation expectations data. |
University Of Michigan Surveys Of Consumers, January 1990 - May 2017 |
| At just 2.3%, it matches December 2016, though it should be noted this is the preliminary figure and may be revised. The first estimate for 5-year forward inflation expectations for March 2017 was thought to be just 2.2%, less than December, but was subsequently revised to the current 2.4%. Regardless, the overall trend remains whatever the ultimate level it may be in the current month or months. |
University Of Michigan Surveys Of Consumer's Confidence, January 1997 - May 2017 |
| The inflation survey isn’t strictly about inflation so much as a projection of more basic economic circumstances. In other words, consumers intuitively know that the economy is in trouble but before the middle of 2014 they remained confident to some degree that the Fed would fix the problem and deliver full recovery as they promised from the very beginning. |
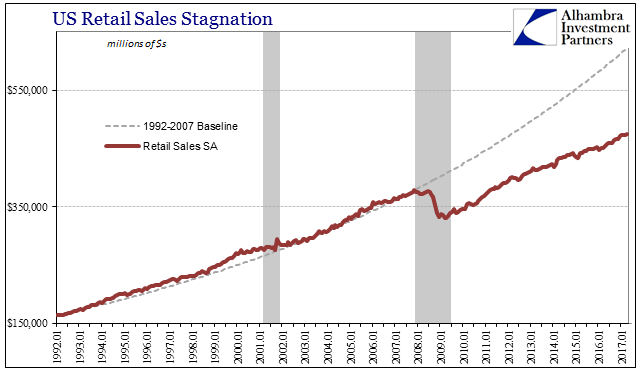
U.S. Retail Sales Stagnation, January 1992 - May 2017 |
| The “rising dollar” was devastating in that regard, for it represented an end to the fairy tale and not in the storybook fashion. The economy was projected in all the mainstream to be on the cusp of taking off in late 2014, which would have fulfilled these steady inflation expectations. They had to that point managed to stay that way no matter what happened after the Great “Recession.” Instead, the economy entered a serious downturn that very publicly contradicted and confused policymakers and economists. The “rising dollar” was simply one too many “unexpected” crises. It is of no surprise that consumers during this time, like markets (not stocks) in the period just before, have re-evaluated their longer run economic assessments. |
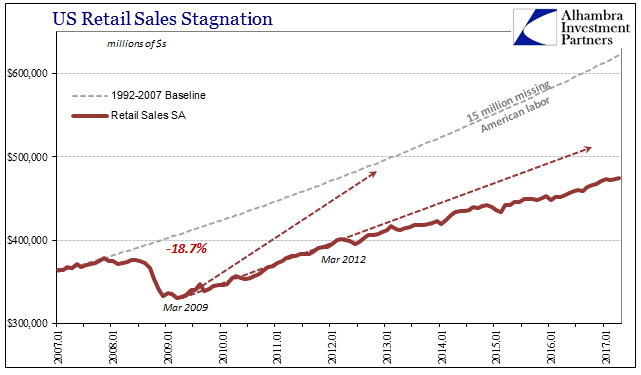
U.S. Retail Sales Stagnation, January 2007 - May 2017 |
Current CPI data merely confirms the pessimism, not that higher inflation is good for anyone other than central bankers. Again, it is not strictly about consumer prices as much as trying to discern the overall economic trend or potential, and being sickened by what little there appears to be. And though headline consumer sentiment is more like the pre-crisis era, that dichotomy is easily reconciled:
If you hadn’t realized it before, you are witness to it now. |
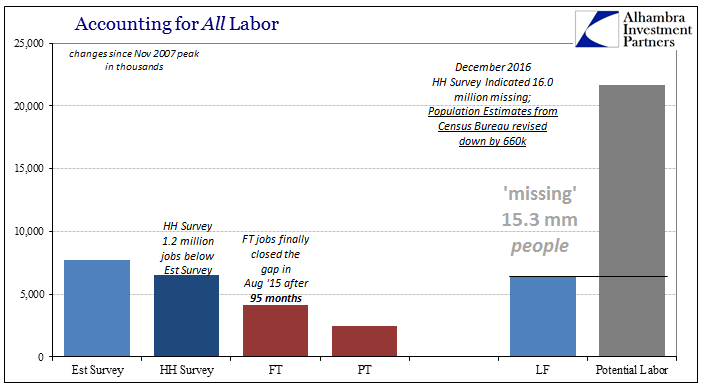
Accounting For All Labor |
Tags: Consumer Prices,Consumer Sentiment,CPI,Crude Oil,currencies,depression,economy,energy prices,Featured,Federal Reserve/Monetary Policy,inflation,inflation expectations,Markets,newsletter,oil prices,QE,rising dollar,survey of consumers,University Of Michigan,uofm,WTI

