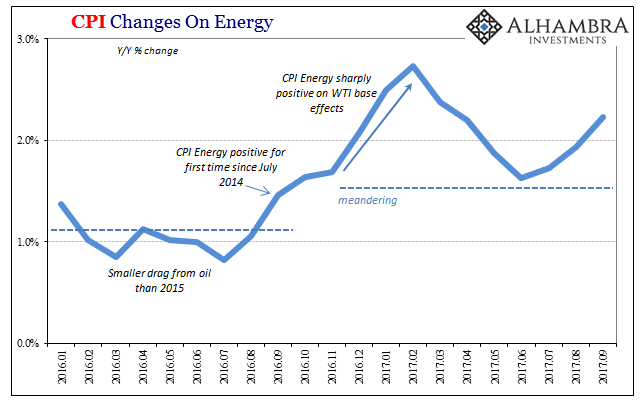
The US Consumer Price Index (CPI) rose back above 2% in September 2017 for the first time since April. Boosted yet again by energy prices, consumer prices overall still aren’t where the Fed needs them to be (by its own policies, not consumer reality). In fact, despite a 10.2% gain in the energy price index last month, the overall CPI just barely crossed the 2% mark (though for the Fed it really needs to be closer to 3% to match a 2% PCE Deflator). US Consumer Price Index, Jan 2016 - Sep 2017(see more posts on U.S. Consumer Price Index, ) - Click to enlarge The energy index rose about the same in September as it did in January and March. US Consumer Price Index, Jan 1988 - 2017(see more posts on U.S. Consumer
Topics:
Jeffrey P. Snider considers the following as important: CPI, currencies, economy, Featured, Federal Reserve/Monetary Policy, inflation, Markets, Money, newsletter, The United States
This could be interesting, too:
Nachrichten Ticker - www.finanzen.ch writes Die Performance der Kryptowährungen in KW 9: Das hat sich bei Bitcoin, Ether & Co. getan
Nachrichten Ticker - www.finanzen.ch writes Wer verbirgt sich hinter der Ethereum-Technologie?
Martin Hartmann writes Eine Analyse nach den Lehren von Milton Friedman
Marc Chandler writes March 2025 Monthly
| The US Consumer Price Index (CPI) rose back above 2% in September 2017 for the first time since April. Boosted yet again by energy prices, consumer prices overall still aren’t where the Fed needs them to be (by its own policies, not consumer reality). In fact, despite a 10.2% gain in the energy price index last month, the overall CPI just barely crossed the 2% mark (though for the Fed it really needs to be closer to 3% to match a 2% PCE Deflator). |
US Consumer Price Index, Jan 2016 - Sep 2017(see more posts on U.S. Consumer Price Index, ) |
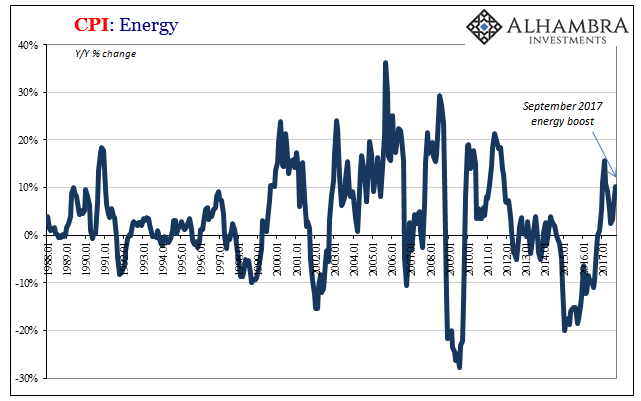
| The energy index rose about the same in September as it did in January and March. |
US Consumer Price Index, Jan 1988 - 2017(see more posts on U.S. Consumer Price Index, ) |
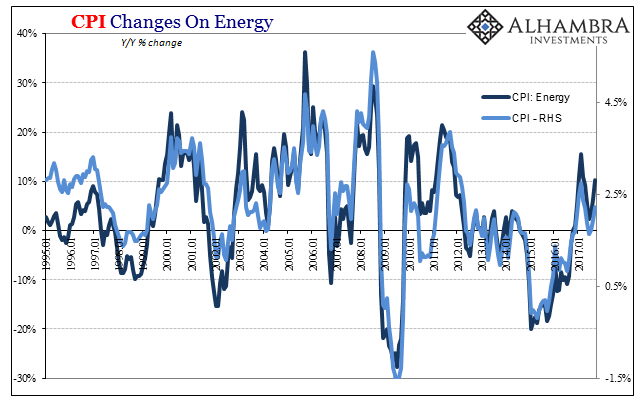
| The headline inflation rate was higher in those months, however, because the rest of the price components have since suggested the opposite of what orthodox theory mandates. |
US Consumer Price Index, Jan 1995 - 2017(see more posts on U.S. Consumer Price Index, ) |
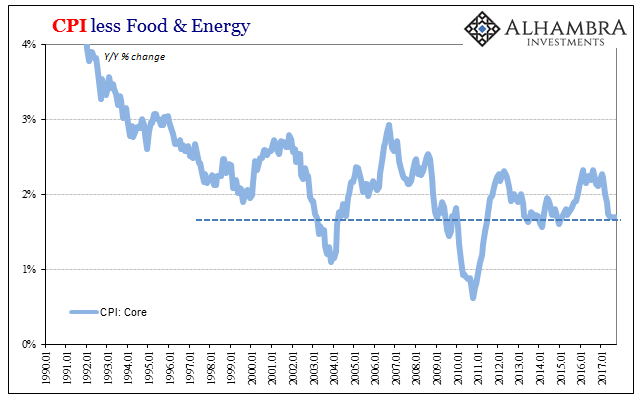
| The core rate, the version excluding energy and food prices, rose by 1.7% in September for the fifth consecutive month. If there was some latent price momentum underlying as all the usual mainstream talk of “transitory” factors demands, the core price level would not just be above 2% it would be rising steadily past it.
In 2005 and 2006, for example, core inflation accelerated consistently up to around 3% as the headline CPI shifted from below 2% (as a result of the sluggish recovery form the dot-com recession) to nearly 5% at the height of the housing bubble. The core rate over the last six years, by contrast, has been remarkably steady in a relatively narrow range at a lower level consistent with the lackluster to awful economy produced in those six years. |
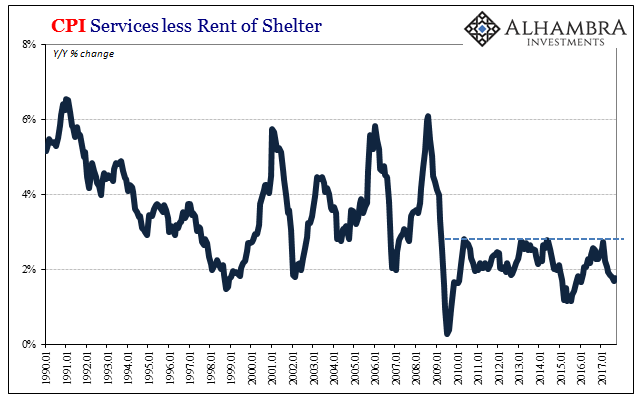
US Consumer Price Index, Jan 1990 - 2017(see more posts on U.S. Consumer Price Index, ) |
| This view is corroborated by other similar CPI details. The index for consumer price changes in services (minus shelter) has been even more stubborn in this position than the core version. It has yet to break out above 3% for any single month the entire time since the Great “Recession.” In more recent months, since January, it has instead decelerated alongside a great many other economic accounts and indications recognizing the complete disappointment of conditions in 2017 (not at all what “reflation” was thinking late last year). |
US Consumer Price Index, Jan 1990 - 2017(see more posts on U.S. Consumer Price Index, ) |
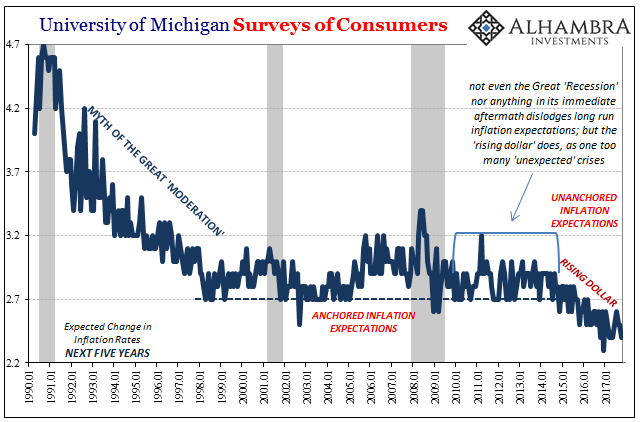
| Despite the headlines for either the PCE Deflator or the CPI, indications for inflation expectations remained subdued all year. That isn’t surprising given the behavior of them – it took years of failure in monetary policy for investors (TIPS) and consumers (surveys) to “unanchor” their inflation outlook(s). |
US University of Michigan Surveys of Consumers, Jan 1990 - 2017(see more posts on University Of Michigan, ) |
| Therefore, a few months here and there on waves of oil and gasoline prices is not going to be a sufficient counterargument to well-established (and so far proven) doubt. |
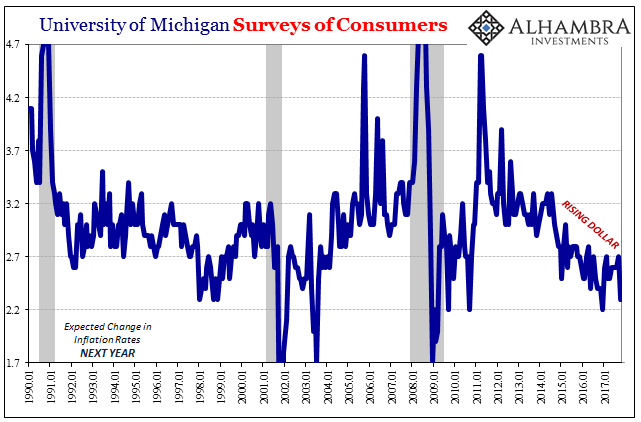
US University of Michigan Surveys of Consumers, Jan 1990 - 2017(see more posts on University Of Michigan, ) |
| Neither the 1-year projection nor the 5-year projection of the University of Michigan’s Surveys of Consumers have budged in 2017. They have, especially in October, kept to the lower end of the recent range dating back to the appearance and effects of the “rising dollar.” What is indicated as “transitory” is not continued economic weakness as Janet Yellen says year after year, but these aberrations sporadically and meekly suggesting (only) to policymakers its end.
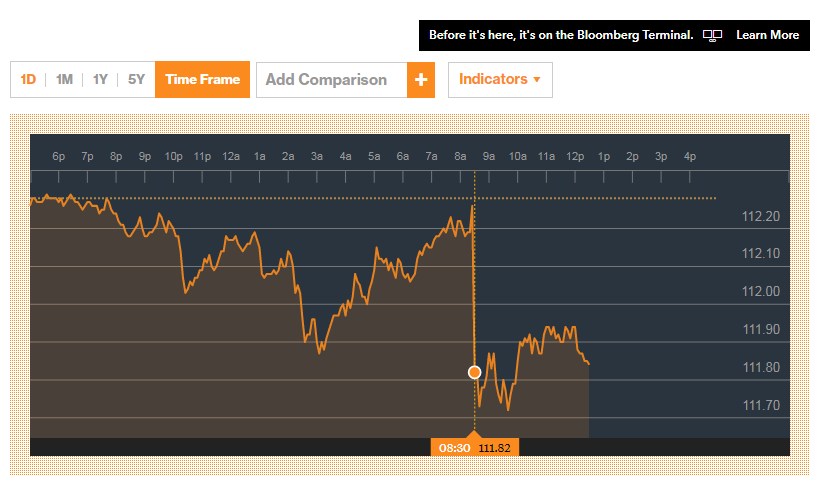
The knee-jerk market reaction (JPY above) was, 2% and all, that disappointment. If Yellen is right, then the CPI report despite its headline favorability really should have produced more that conformed to the narrative. It didn’t; in fact, it showed up with less. It’s why more and more economists and policymakers have become impatient, showing their restlessness over inflation in public. |
CPI JPY Intraday |
Former Fed Governor Daniel Tarullo, one of the few on the FOMC who would occasionally acknowledge the reality of the last ten years, wrote recently:
The mainstream, policy problem is much larger than inflation expectations. It is, in fact, an entire monetary problem in that monetary policy doesn’t contain any money in it. It hasn’t for a very, very long time. |
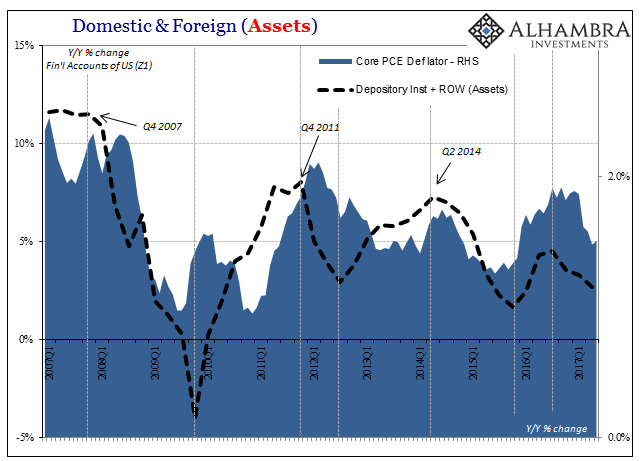
Domestic & Foreign Assets, Q1 2007 - 2017 |
| The difference in expectations is that even the most unaware of people, those who have not ever heard the word eurodollar ever uttered just once, have finally begun to suspect as much; that the central bank may be central only in the media perception, and not really much of a bank. |
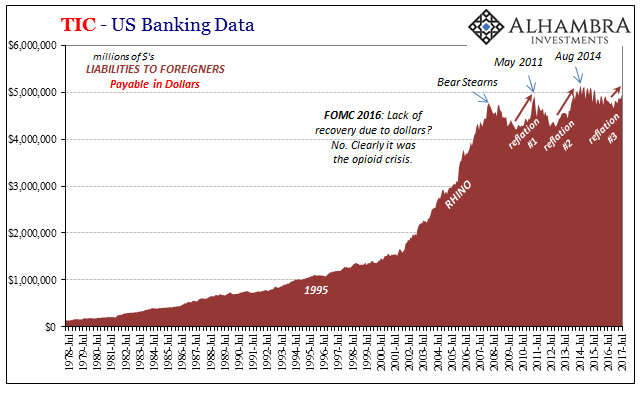
US Banking Data, Jul 1978 - 2017 |
Tags: CPI,currencies,economy,Featured,Federal Reserve/Monetary Policy,inflation,Markets,money,newsletter

