Swiss Franc Currency Index In the last week, the Swiss Franc index lost a little territory as compared to the dollar index. Finally it ended, where it started one month ago. Trade-weighted index Swiss Franc, April 08(see more posts on Swiss Franc Index, ) Source: markets.ft.com - Click to enlarge Swiss Franc Currency Index (3 years) The Swiss Franc index is the trade-weighted currency performance (see the currency basket)On a three years interval, the Swiss Franc had a weak performance. The dollar index was far stronger. The dollar makes up 33% of the SNB portfolio and 25% of Swiss exports (incl. countries like China or Arab countries that use the dollar for exchanges). Contrary to popular believe, the CHF index gained only 1.73% in 2015. It lost 9.52% in 2014, when the dollar (and yuan) strongly improved. Swiss Franc Currency Index (3 years), April 08(see more posts on Swiss Franc Index, ) Source: markets.ft.com - Click to enlarge USD/CHF The US dollar appreciated against most of the major currencies last week. The Japanese yen was the chief exception. It rose about 0.5% as US yields remained heavy and equities were mostly softer. US Dollar/Swiss Franc FX Spot Rate, April 08(see more posts on USD/CHF, ) Source: markets.ft.
Topics:
George Dorgan considers the following as important: Australian Dollar, Bollinger Bands, British Pound, Canadian Dollar, Crude Oil, EUR-USD, EUR/CHF, Euro, Euro Dollar, Featured, FX Trends, Japanese Yen, MACDs Moving Average, Mario Draghi, newslettersent, RSI Relative Strength, S&P 500 Index, S&P 500 Index, Stochastics, Swiss Franc Index, U.S. Dollar Index, U.S. Treasuries, USD/CHF, USDJPY
This could be interesting, too:
Nachrichten Ticker - www.finanzen.ch writes Die Performance der Kryptowährungen in KW 9: Das hat sich bei Bitcoin, Ether & Co. getan
Nachrichten Ticker - www.finanzen.ch writes Wer verbirgt sich hinter der Ethereum-Technologie?
Marc Chandler writes March 2025 Monthly
Mark Thornton writes Is Amazon a Union-Busting Leviathan?
Swiss Franc Currency IndexIn the last week, the Swiss Franc index lost a little territory as compared to the dollar index. Finally it ended, where it started one month ago. |
Trade-weighted index Swiss Franc, April 08(see more posts on Swiss Franc Index, )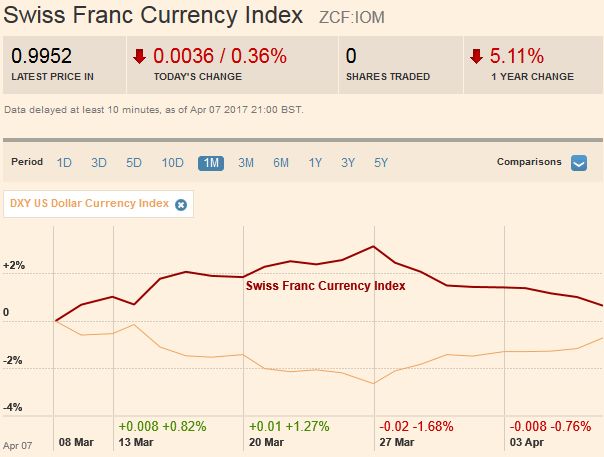 Source: markets.ft.com - Click to enlarge |
Swiss Franc Currency Index (3 years)The Swiss Franc index is the trade-weighted currency performance (see the currency basket)On a three years interval, the Swiss Franc had a weak performance. The dollar index was far stronger. The dollar makes up 33% of the SNB portfolio and 25% of Swiss exports (incl. countries like China or Arab countries that use the dollar for exchanges).
|
Swiss Franc Currency Index (3 years), April 08(see more posts on Swiss Franc Index, )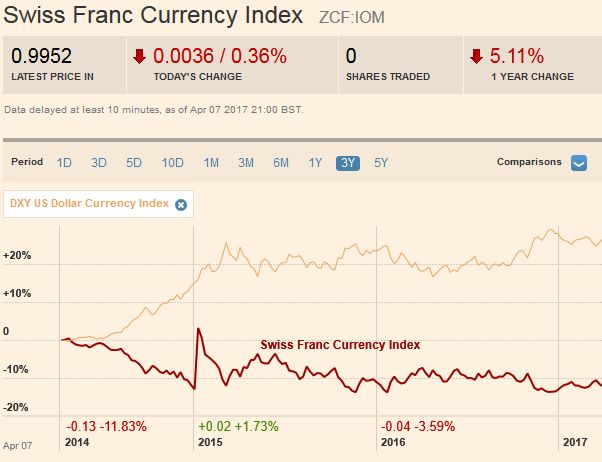 Source: markets.ft.com - Click to enlarge |
USD/CHFThe US dollar appreciated against most of the major currencies last week. The Japanese yen was the chief exception. It rose about 0.5% as US yields remained heavy and equities were mostly softer. |
US Dollar/Swiss Franc FX Spot Rate, April 08(see more posts on USD/CHF, )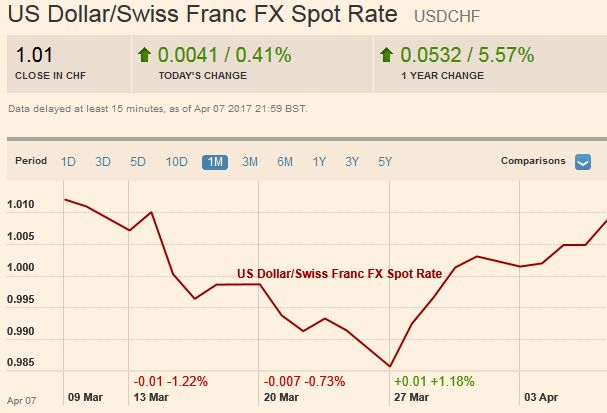 Source: markets.ft.com - Click to enlarge |
US Dollar IndexThe Dollar Index did not fall in any session last week. It has had one losing session over the past nine, and that was the last day in March when the Dollar Index slipped less than 0.1%. It finished the week a bit above thee 61.8% retracement objective of the decline from last month’s peak (March 9) near 102.25, found just below 101.00 A trend line from the January and March highs is found near 101.40 by the end of next week. It corresponds to the 50% retracement of the Dollar Index decline from the January high, and near the upper Bollinger Band (~101.55 now). The 61.8% retracment of this larger move is found a little below 102. The technical indicators are constructive, and the five-day moving average crossed above the 20-day average for the first time since the Fed hiked rates in the middle of March. |
US Dollar Currency Index, April 08(see more posts on U.S. Dollar Index, )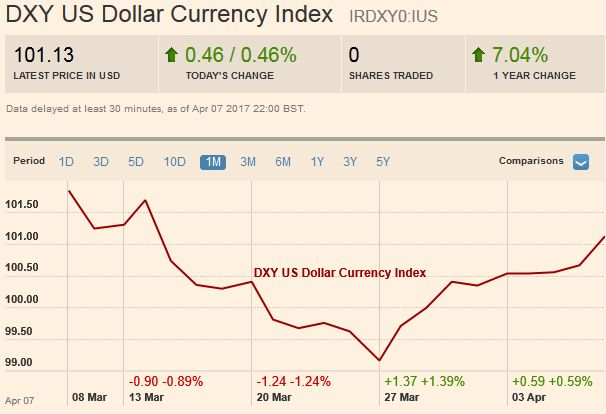 Source: markets.ft.com - Click to enlarge |
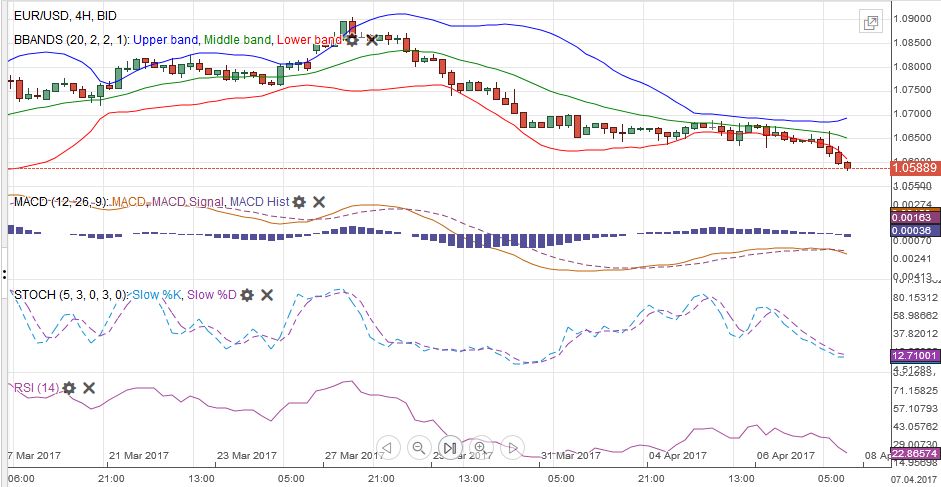
EUR/USDThe euro fell about 0.5% against the dollar last week after falling about 1.35% the previous week. It has only risen in three of the past ten sessions. It has been sufficient to push the five-day moving average back below the 20-day average for the first time since March 9. The Slow Stochastics are trending lower, but are approaching zero. The MACDs were turning lower at the end of last week and continued to ease. The RSI is drifting lower. The trend line connecting the January and March lows seen in the $1.0580, which is just above the lower Bollinger Band (~$1.0575), was teased ahead of the weekend. A break would target $1.0500-$1.0525. We had thought potential extended a little above $1.07 last week, but the euro did not get much above $1.0685, where we would now recognize resistance. The euro’s slump is consistent with the wider interest rate differentials as US yields edged higher and German yields eased. |
EUR/USD with Technical Indicators, April 03-08(see more posts on Bollinger Bands, EUR / USD, MACDs Moving Average, RSI Relative Strength, Stochastics, ) |
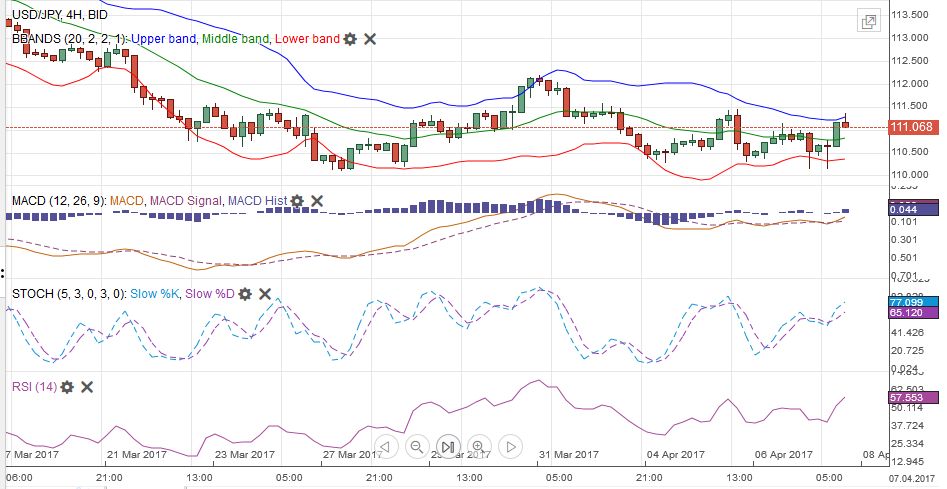
USD/JPYThree times over the past five sessions, the dollar dipped below JPY110.30 to approach significant support around JPY110. This area held in late March as well, but the inability of the sustain modest upticks keeps the greenback vulnerable. There have been 17 sessions since the Fed hiked and the dollar has closed lower in all but four. A break below JPY110 still appears as the pain trade, and optionality and stops would likely be triggered, which could lead to an air pocket. The risk of this lessened at the end of last week as the dollar staged an impressive recovery after initially falling to new lows for the week. Japanese investors may be taking advantage of strong yen to return to global asset markets at the start of the new fiscal year. On the upside, the JPY111.20-JPY111.50 band needs to be overcome, but only to set up a test on more formidable resistance around JPY112.00-JPY112.20. We think there is a reasonable chance that this recovery off JPY110 level can spur a return to the JPY114.00-JPY115.00 |
USD/JPY with Technical Indicators, April 03-08(see more posts on Bollinger Bands, MACDs Moving Average, RSI Relative Strength, Stochastics, USD/JPY, ) |
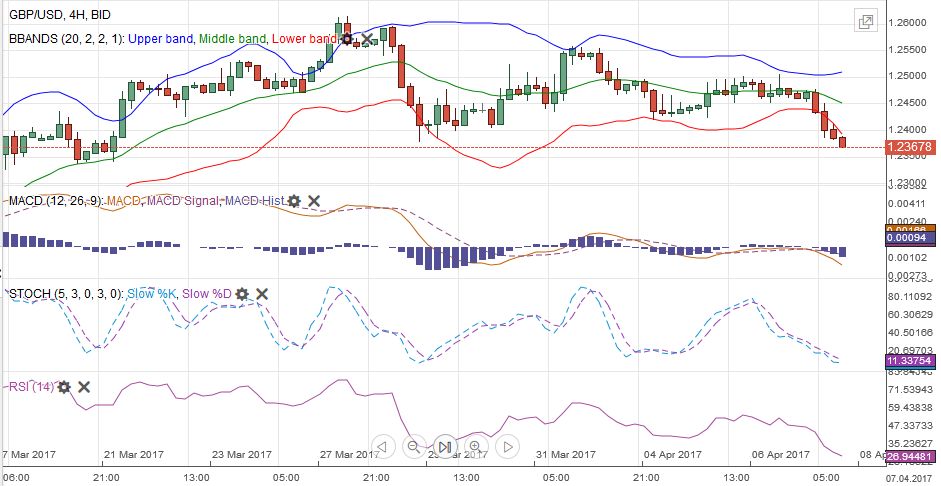
GBP/USDSterling lost a nearly than 1.5% last week, with half the losses coming after disappointing industrial production, manufacturing output, construction, and a wider than expected trade shortfall at the end of the week. The low, near $1.2365, was recorded after the US employment data. It is also the 50% retracement objective of the rally that began the day before the Fed raised rates last month. The 61.8% retracement is at $1.23. A move above the $1.2420–$1.2450 area would help stabilize the technical tone. Sterling finished the week below its 20-day moving average for the first time since March 15. The five-day average has not moved below the 20-day average but appears set to do so in the coming sessions. |
GBP/USD with Technical Indicators, April 03-08(see more posts on Bollinger Bands, GBP/USD, MACDs Moving Average, RSI Relative Strength, Stochastics, ) |
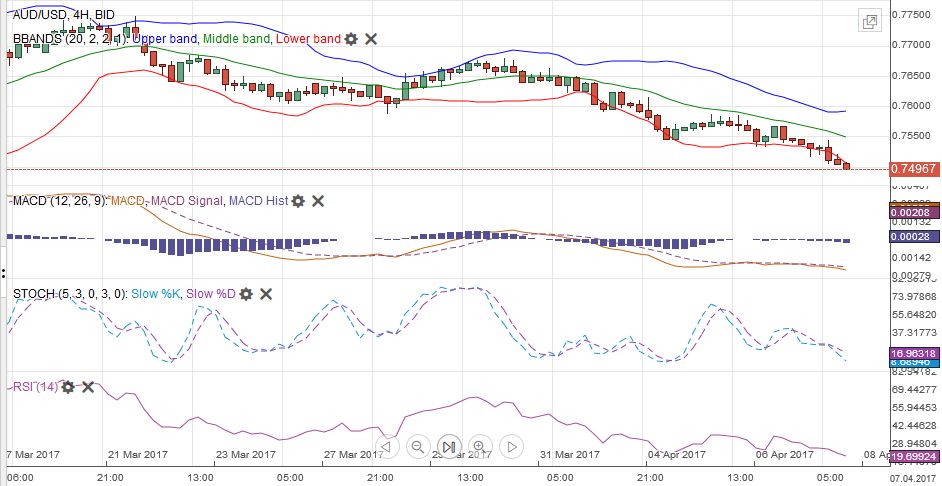
AUD/USDThe Australian dollar’s 1.7% decline eclipsed sterling as the weakest of the major currencies last week. It has risen only four times over the past 15 sessions. It had reached of $0.7750, the highest since the US election on March 21 and subsequently has fallen to approach the March low was near $0.7490. The technical indicators warn of the risk of additional near-term losses. The Aussie finished a little below the $0.7525 area which represents a 38.2% retracement of this year’s gains, and the 100-day moving average is near $0.7515. The 50% retracement is found near $0.7455, and the 61.8% retracement is $0.7385. The 200-day moving average is near $0.7550, and this is reasonable resistance. The $0.7490 area may represent the neckline of a double top (February 23 ~$0.7740 and March 21 ~$0.7750. If valid, the measuring objective is near $0.7230. |
AUD/USD with Technical Indicators, April 03-08(see more posts on Australian Dollar, Bollinger Bands, MACDs Moving Average, RSI Relative Strength, Stochastics, ) |
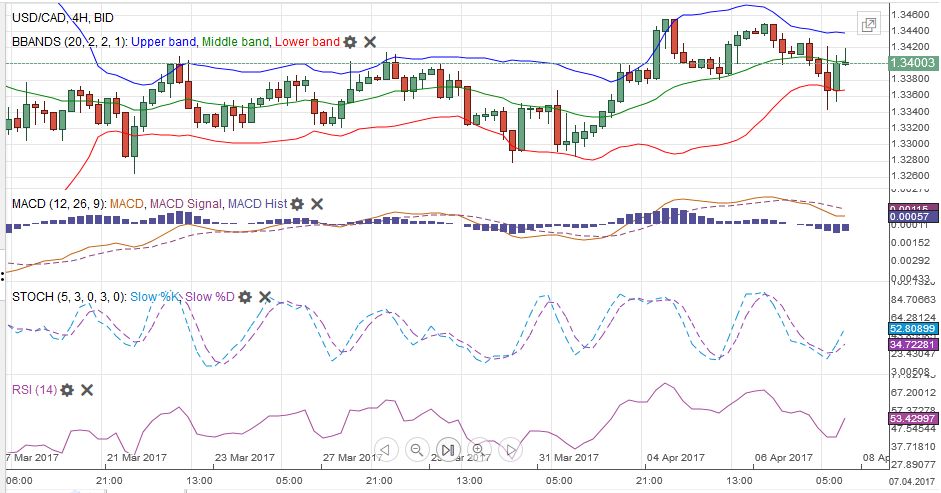
USD/CADThe Canadian dollar rose on the back of another month of solid job creation, which helped it resist US dollar strength ahead of the weekend. The Bank of Canada meets next week, and although economic data have generally been firm, the policy is on hold, while the Fed’s minutes were somewhat hawkish and, judging by the Fed funds futures, is gradually upgrading the odds of a June hike. Bloomberg’s calculation puts the odds at 55.6%, up five percentage points on the week, while the CME’s interpolation puts the odds a little above 59%. The technical indicators are not generating strong signals, though the Slow Stochastics is still trending lower. The CAD1.3325-CAD1.3345 support area held after the employment report. A break could see CAD1.3200-CAD1.3250. On the upside, a move above CAD1.3450 would target the year’s high near CAD1.3535. |
USD/CAD with Technical Indicators, April 03-08(see more posts on Bollinger Bands, Canadian Dollar, MACDs Moving Average, RSI Relative Strength, Stochastics, ) |
Crude OilOil prices rallied after the US missile strike in Syria. US President Trump said the picture of the human tragedy from what strongly appears as Syrian use of chemical weapons changed his views. Previously, Trump had tweeted more than a dozen times about the folly of attacking Syrian President Assad’s forces. Also, when Obama’s support was low, but above where Trump’s is today, Trump cautioned that Obama would strike Libya or Iran to distract attention. Ironically, Russia is accusing Trump of the same thing now. To be sure, the rally in oil prices started well before these incidents. The May light sweet crude oil contract has advanced in eight of the nine past sessions to approach $53 a barrel, which corresponds to a 61.8% retracement of this year’s decline. A downtrend line drawn off the early January high ($57.50), and the February highs (~$55.25-$55.30) is found near $53.40 at the start of the new week and around $53.10 by the end of the week. Support is in the $51.45-$51.75 band. |
Crude Oil, April 2016 - April 2017(see more posts on Crude Oil, )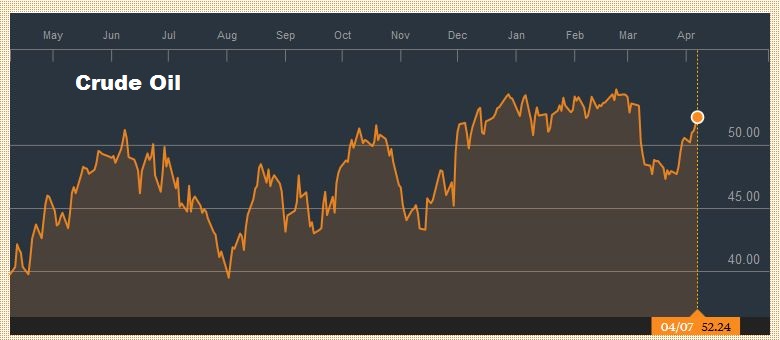 Source: bloomberg.com - Click to enlarge |
U.S. TreasuriesA combination of forces, including some safe haven demand after the US military strike, saw the US 10-year yield fall to a new low for the year (a little below 2.27%) before recovering smartly following the US employment data, where disappointment was shrugged off on ideas that the weather distortions skewed report.
The 2.40%-2.42% yield is the next hurdle. The June note futures staged a key reversal, making news highs for the move and then sell-off through the previous day’s low. Initial support near 124-24 was approach before the weekend, and a break could spur a move toward 124-00.
The 20-day moving average is near 124-10 and 123-27 is the 61.8% retracement objective of the rally since the Fed’s March hike. The Slow Stochastics have turned lower, and the MACDs are about to cross.
|
Yield US Treasuries 10 years, April 2016 - April 2017(see more posts on U.S. Treasuries, )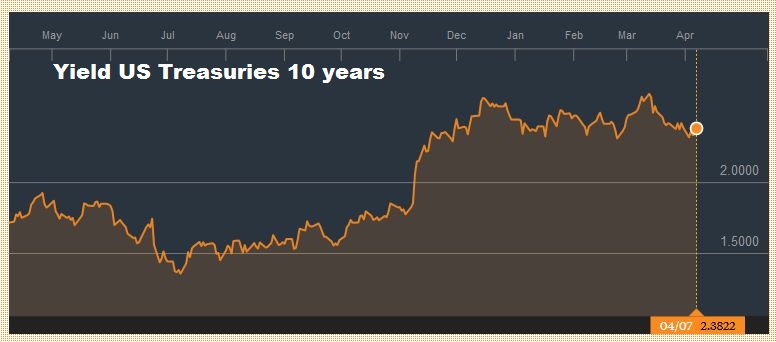 Source: bloomberg.com - Click to enlarge |
S&P 500 IndexFor six weeks, the S&P 500 has alternated between advances and declines and produced a small net decline. It is not clear that the consolidative phase is over, and the technical indicators are not now particularly helpful. The FOMC minutes indicated there was some concern about elevated equity prices, which could suggest that a pullback would not be disconcerting for the central bank. The week’s high was set on Wednesday near 2378.35, but since then, it has been unable to rise above 2365. Several large US banks report earnings next week, which will surely draw attention. Some officials have cited profitability in the financial sector to counter claims that Dodd-Frank is hurting US banks. We suspect a break move above 2374 would be an early signal of another run at the record near 2401. Initial support is seen around 2350. |
S&P 500 Index, April 08(see more posts on S&P 500 Index, )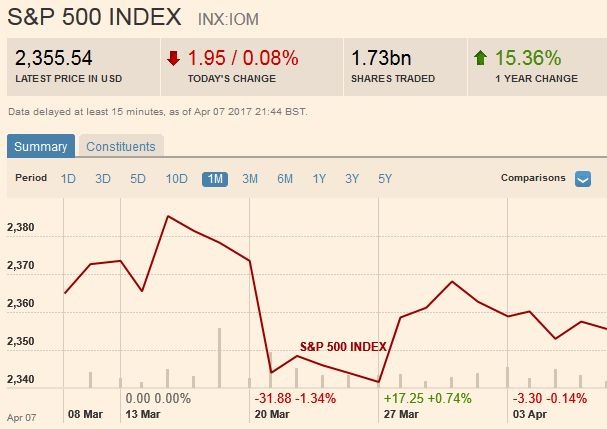 Source: markets.ft.com - Click to enlarge |
Tags: Australian Dollar,Bollinger Bands,British Pound,Canadian Dollar,Crude Oil,EUR / USD,EUR/CHF,Euro,Euro Dollar,Featured,Japanese yen,MACDs Moving Average,Mario Draghi,newslettersent,RSI Relative Strength,S&P 500 Index,Stochastics,Swiss Franc Index,U.S. Dollar Index,U.S. Treasuries,USD/CHF,USD/JPY

