Swiss Franc Currency Index In the last week, the Swiss Franc index recovered and gained about 2%. The dollar index lost 1.5%, Trade-weighted index Swiss Franc, March 25(see more posts on Swiss Franc Index, ) Source: markets.ft.com - Click to enlarge Swiss Franc Currency Index (3 years) The Swiss Franc index is the trade-weighted currency performance (see the currency basket)On a three years interval, the Swiss Franc had a weak performance. The dollar index was far stronger. The dollar makes up 33% of the SNB portfolio and 25% of Swiss exports (incl. countries like China or Arab countries that use the dollar for exchanges). Contrary to popular believe, the CHF index gained only 1.73% in 2015. It lost 9.52% in 2014, when the dollar (and yuan) strongly improved. Swiss Franc Currency Index (3 years), March 25(see more posts on Swiss Franc Index, ) Source: markets.ft.com - Click to enlarge USD/CHF Position adjustment in the foreign exchange market continued to dominate the price action. The dollar tended to trade heaviest against those currencies that speculators were short, like the euro, yen, and sterling. It tended to rise against currencies that speculators were long such as the Australian and Canadian dollar.
Topics:
George Dorgan considers the following as important: Australian Dollar, Bollinger Bands, British Pound, Canadian Dollar, Crude Oil, EUR-USD, EUR/CHF, Euro, Euro Dollar, Featured, FX Trends, Japanese Yen, MACDs Moving Average, Mario Draghi, newslettersent, RSI Relative Strength, S&P 500 Index, S&P 500 Index, Stochastics, Swiss Franc Index, U.S. Dollar Index, U.S. Treasuries, USD/CHF, USDJPY
This could be interesting, too:
Nachrichten Ticker - www.finanzen.ch writes Die Performance der Kryptowährungen in KW 9: Das hat sich bei Bitcoin, Ether & Co. getan
Nachrichten Ticker - www.finanzen.ch writes Wer verbirgt sich hinter der Ethereum-Technologie?
Marc Chandler writes March 2025 Monthly
Mark Thornton writes Is Amazon a Union-Busting Leviathan?
Swiss Franc Currency IndexIn the last week, the Swiss Franc index recovered and gained about 2%. The dollar index lost 1.5%, |
Trade-weighted index Swiss Franc, March 25(see more posts on Swiss Franc Index, )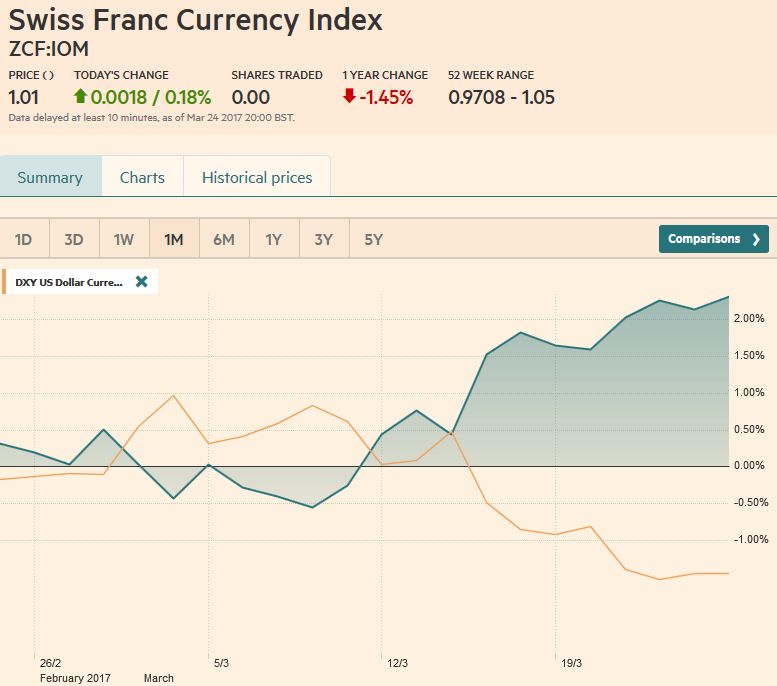 Source: markets.ft.com - Click to enlarge |
Swiss Franc Currency Index (3 years)The Swiss Franc index is the trade-weighted currency performance (see the currency basket)On a three years interval, the Swiss Franc had a weak performance. The dollar index was far stronger. The dollar makes up 33% of the SNB portfolio and 25% of Swiss exports (incl. countries like China or Arab countries that use the dollar for exchanges).
|
Swiss Franc Currency Index (3 years), March 25(see more posts on Swiss Franc Index, )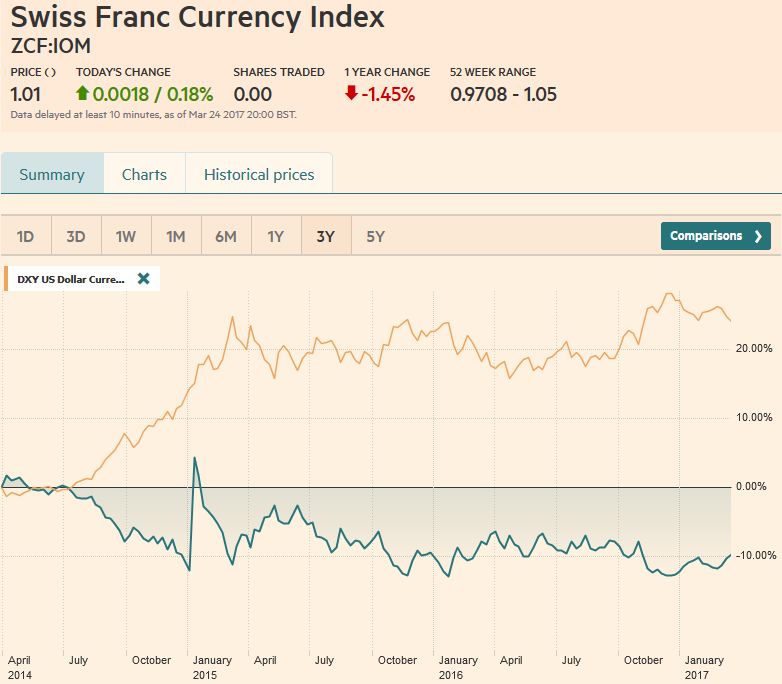 Source: markets.ft.com - Click to enlarge |
USD/CHFPosition adjustment in the foreign exchange market continued to dominate the price action. The dollar tended to trade heaviest against those currencies that speculators were short, like the euro, yen, and sterling. It tended to rise against currencies that speculators were long such as the Australian and Canadian dollar. Judging from the market’s (initial) response to the inability of the US House of Representatives to agree on an alternative to the Affordable Care Act, the prospect of bringing forward tax reform may have appeased investors. We are less sanguine but recognize that the dollar’s resilience ahead of the weekend could be a preliminary sign that recent fall may be nearly over. |
US Dollar/Swiss Franc FX Spot Rate, March 25(see more posts on USD/CHF, )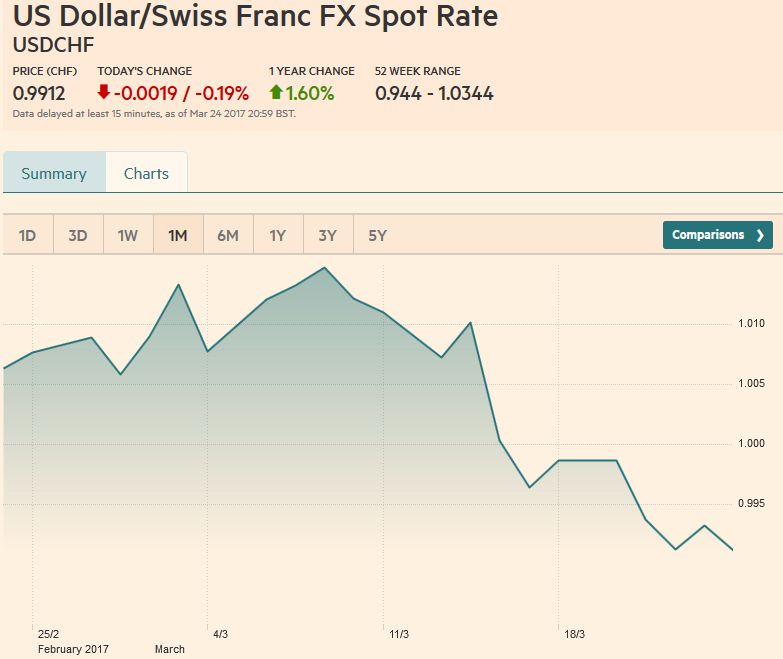 Source: markets.ft.com - Click to enlarge |
US Dollar IndexThe Dollar Index’s price action has been streaky this year. Leave aside the first week of the New Year, when the Dollar Index was practically flat. It fell for four weeks, then rose for four weeks, and now just completed its third consecutive weekly decline. The technical indicators warn that the downdraft is not over. Key support is seen in the 99.20-99.45 area. It corresponds to the lows of the past four months. It is also where some see a large head and shoulders top pattern, which if convincingly violated could suggest a measuring objective near 94.50. Before getting there, the Dollar Index rally, since last May’s lows, would be half given back near 98.40 and would retrace 61.8% of its gains if it fell to 97.15. Nearby resistance is seen at 100.00. |
US Dollar Currency Index, March 25(see more posts on U.S. Dollar Index, )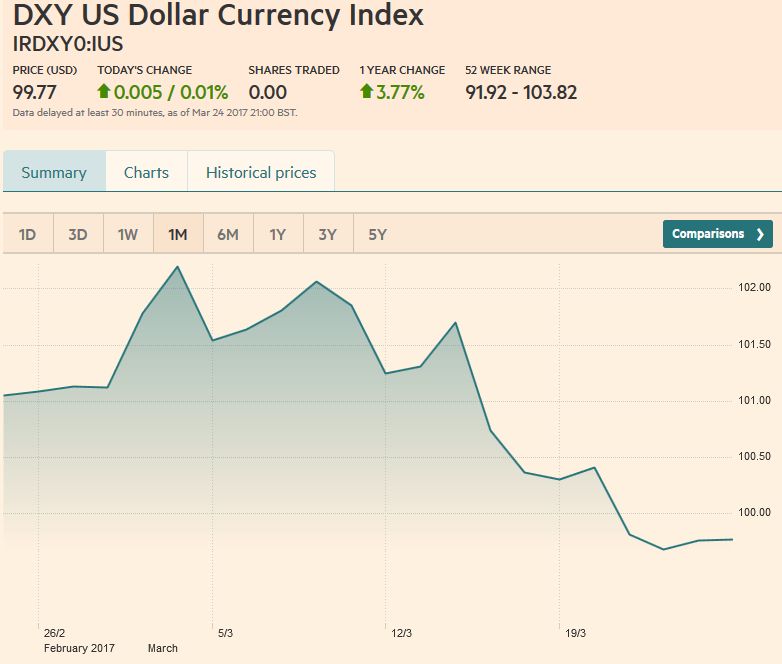 Source: markets.ft.com - Click to enlarge |
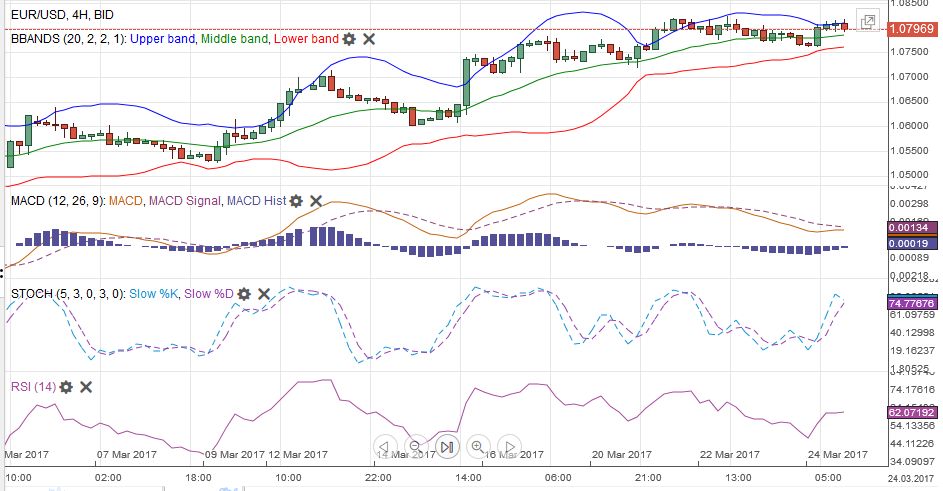
EUR/USDThe euro has tested, backed off, and has again approached an important technical milestone around $1.0820-$1.0830. It corresponds to the 50% retracement of the sell-off since the US election. It is also where the euro peaked in early February. The early December high was near $1.0875, and the 61.8% retracement $1.0935. The MACDs and Slow Stochastics are getting stretched. In this situation, be on the lookout for a reversal pattern that would turn the indicators lower. In terms of levels, $1.07 looks significant, and the euro has not traded below it since the Fed hiked, and the populists were denied the reins of power in the Netherlands. |
EUR/USD with Technical Indicators, March 20 - 25(see more posts on Bollinger Bands, EUR / USD, MACDs Moving Average, RSI Relative Strength, Stochastics, ) |
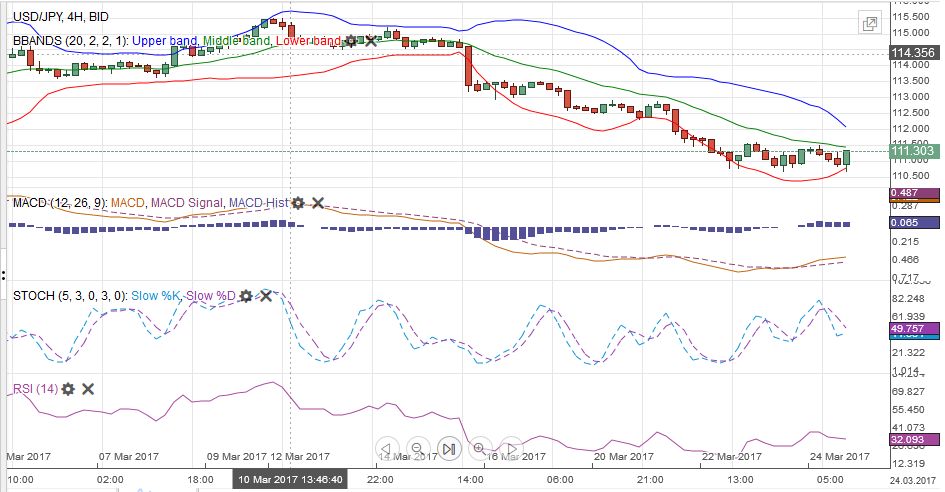
USD/JPYThe dollar’s eight-day drop against the yen was arrested before the weekend. In this span, the greenback fell from near JPY115 to almost JPY110.60. The technical indicators have not turned, warning that a low in price may not yet be in place. We anticipate demand will emerge ahead of the JPY110 level. The risk-reward would seem to shift, and the start of the new fiscal year on April 1 could see investment outflows. A move above JPY112.00 may help stabilize the tone. |
USD/JPY with Technical Indicators, March 20 - 25(see more posts on Bollinger Bands, MACDs Moving Average, RSI Relative Strength, Stochastics, USD/JPY, ) |
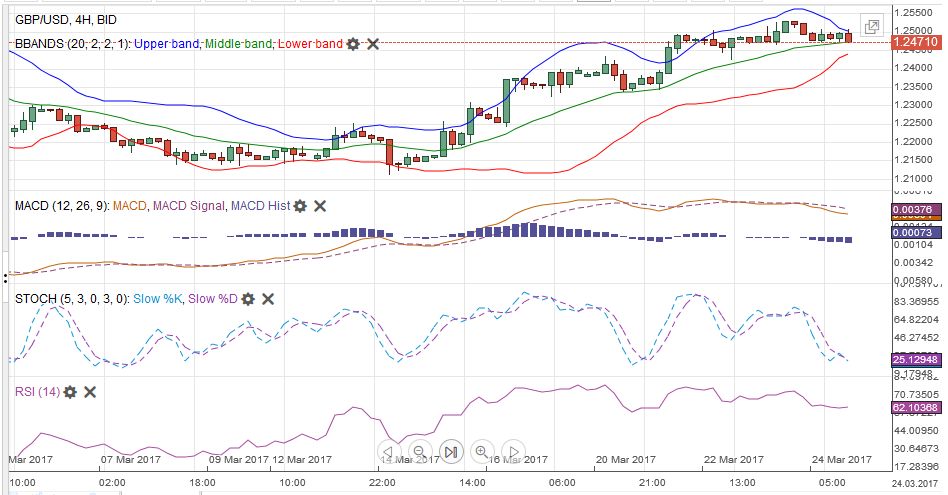
GBP/USDSterling rallied a little more than four cents since the Fed’s hike. The hawkish dissent at the Bank of England and a less neutral sounding statement, coupled with a better than expected retail sales report (despite softer income growth), helped sterling outperform all the major currencies since March 15 save the yen. Over this period, sterling has not closed below its five-day moving average (~$1.2465) and to do so now could signal a pullback of two cents toward $1.2320, the 50% retracement of the recent advance, and the 20-day moving average. On the upside, a move above $1.2530 signals scope for another half-cent rise before meeting what is likely to be stiffer resistance. |
GBP/USD with Technical Indicators, March 20 - 25(see more posts on Bollinger Bands, GBP/USD, MACDs Moving Average, RSI Relative Strength, Stochastics, ) |
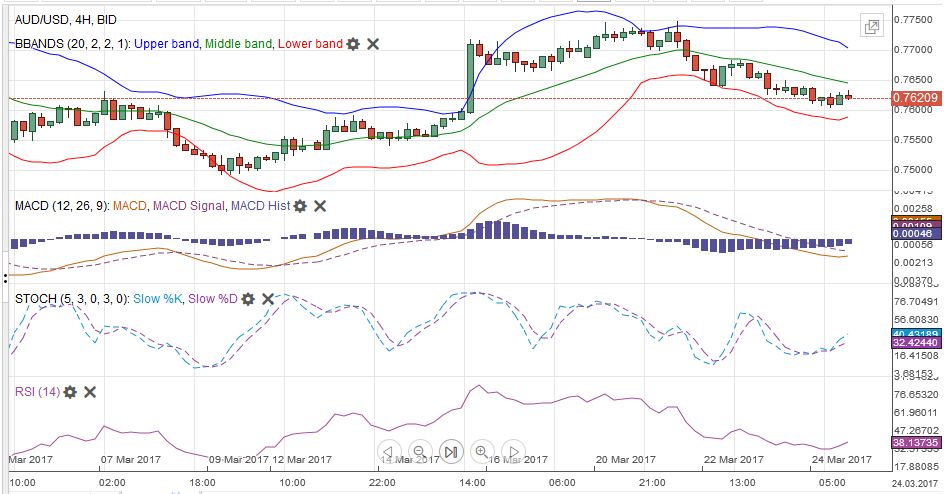
AUD/USDThe only major currency weaker than the Canadian dollar last week (-0.2%) was the Australian dollar (-1%). The similar correlation between the Australian dollar and the two-year rate differential is at 0.48, and over the past decade, it rarely is above 0.5. The Aussie’s pullback last week held $0.7600, which is an important congestion area and the 61.8% of the gains it has scored since briefly dipping below $0.7500 on March 9. The technical indicators favor the peeling back more of the Aussie’s recent gains. The price action reaffirms and strengthens the resistance around $0.7700 and sets up an important test on $0.7500, with modest support seen first near $0.7550. |
AUD/USD with Technical Indicators, March 20 - 25(see more posts on Australian Dollar, Bollinger Bands, MACDs Moving Average, RSI Relative Strength, Stochastics, ) |
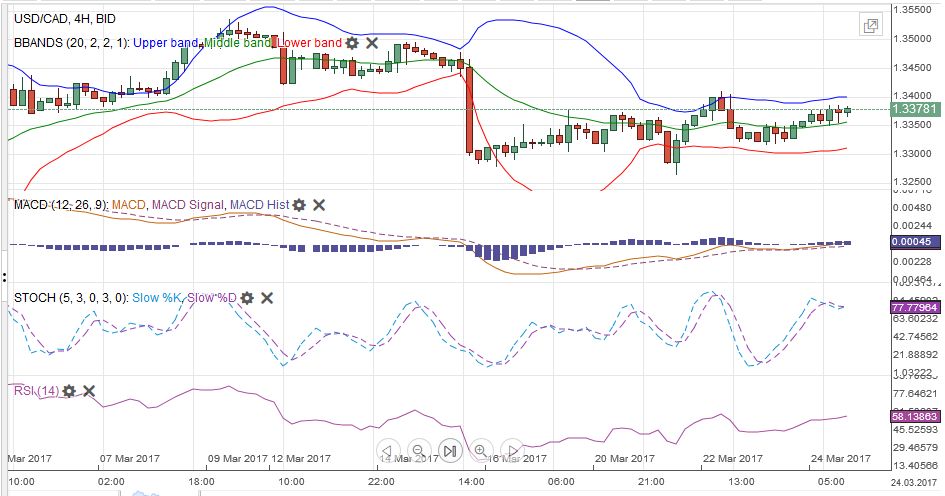
USD/CADWhile short-run streaks have characterized the recent price action of several currencies, the Canadian dollar is an exception. It has been particularly choppy. The US dollar’s recent peak against the Canadian dollar was on March 9, nearly a week before the Fed’s hike, and took a big step down on the announcement. It covered half of this year’s range over eight sessions, moving from CAD1.3535 to CAD1.3265. The CAD1.3250 is the 50% retracement of the US dollar gains since late January’s low near CAD1.2970. The 61.8% retracement is near CAD1.3185, while the 200-day moving average is a little above CAD1.3190. We note that the (60-day) correlation between (percentage) change of the two-year interest rate differential between the US and Canada and the exchange rate is around 0.65, the strongest in more than a decade. The RSI and Slow Stochastics are somewhat more favorable than the MACDs, but they may turn with any additional US dollar gains. |
USD/CAD with Technical Indicators, March 20 - 25(see more posts on Bollinger Bands, Canadian Dollar, MACDs Moving Average, RSI Relative Strength, Stochastics, ) |
Crude OilMay light sweet crude futures contract made a new four-month low in the middle of last week (~$47). It snapped back leaving a potential bullish divergence in the RSI and Slow Stochastics. The MACDs look poised to cross higher on the slightest of upticks now. A push through the $48.60-$49.00 band would lift the tone, after falling in three of the past four weeks. While a near-term recovery may be at hand, the longer-term technicals, warn of further downside risks. |
Crude Oil, March 2016 - March 2017(see more posts on Crude Oil, )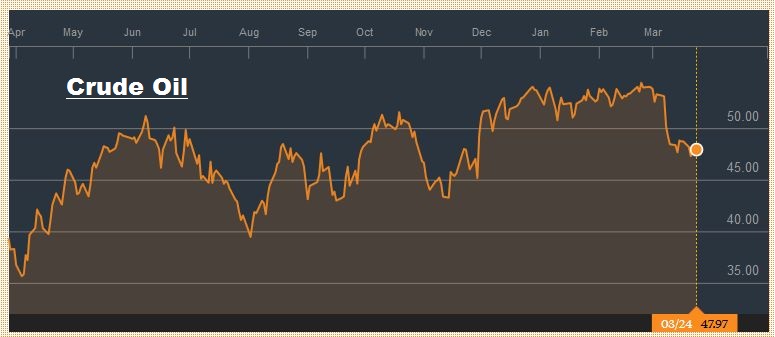 Source: bloomberg.com - Click to enlarge |
U.S. TreasuriesThe US 10-year yield has risen in only two of the eight sessions since March 14. The yield remains well entrenched in its four-month range of roughly 2.30% to roughly 2.60%. The third rate hike in the current gradual cycle and the second one in four months failed to change the pattern. Yields run up on the anticipation of a hike and then come off when it is delivered. Although the downside momentum eased, it is not clear that the low yield print on this leg is in place. The May futures contract closed firmly, and the market seems to want to test the range between 124-23 and 125-00, which could be a formidable cap. |
Yield US Treasuries 10 years, Mar 2016 - Mar 2017(see more posts on U.S. Treasuries, )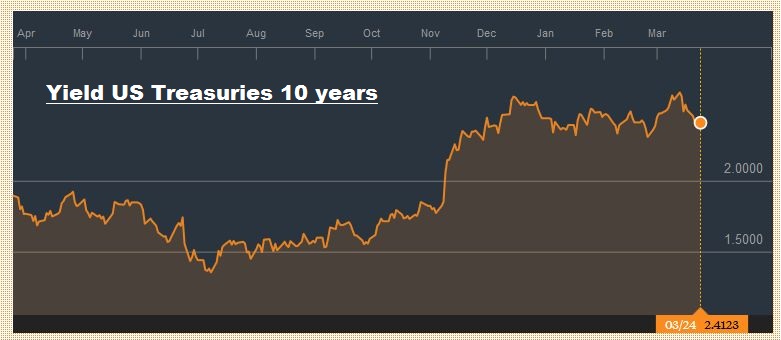 Source: bloomberg.com - Click to enlarge |
S&P 500 IndexThe S&P 500 has also only risen in two sessions since the Fed hiked. In the bigger picture, the S&P 500 is consolidating gains scored in a six-week advance. The consolidation means a drift lower, which has been sufficient to push the five-day average below the 20-day for the first time since early January. Last week’s pullback stopped just shy of the 38.2% retracement of this year’s rally (~2337). The 50% retracement is near 2317. The technical indicators warn of the risk that the correction continues, though a move above 2369 would indicate that phase is over. |
S&P 500 Index, March 25(see more posts on S&P 500 Index, )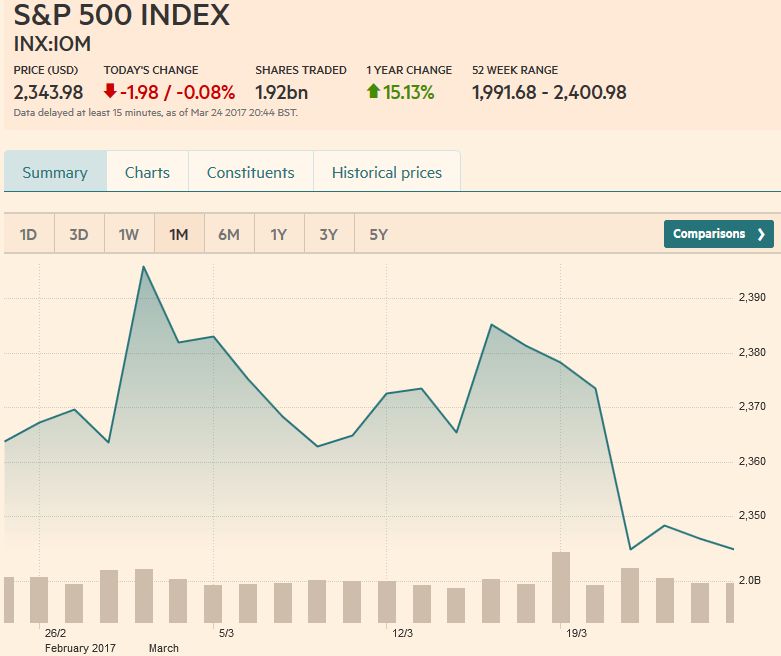 Source: markets.ft.com - Click to enlarge |
Tags: Australian Dollar,Bollinger Bands,British Pound,Canadian Dollar,Crude Oil,EUR / USD,EUR/CHF,Euro,Euro Dollar,Featured,Japanese yen,MACDs Moving Average,Mario Draghi,newslettersent,RSI Relative Strength,S&P 500 Index,Stochastics,Swiss Franc Index,U.S. Dollar Index,U.S. Treasuries,USD/CHF,USD/JPY

