Friday , April 26 2024
Home / Tag Archives: U.S. Treasuries (page 3)

Tag Archives: U.S. Treasuries

One Shock Case For ‘Irrational Exuberance’ Reaching A Quarter-Century

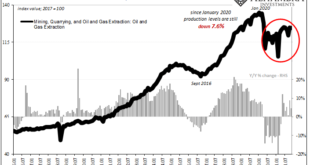
Have oil producers shot themselves in the foot, while at the same time stabbing the global economy in the back? It’d be quite a feat if it turns out to be the case, one of those historical oddities that when anyone might honestly look back on it from the future still hung in disbelief. Let’s start by reviewing just the facts. First up, yesterday the Federal Reserve published the November 2021 estimates for Industrial Production in the United States. As has been the...

Read More »

Playing Dominoes

That was fast. Just yesterday I said watch out for when the oil curve flips from backwardation to contango. When it does, that’s not a good sign. Generally speaking, it means something has changed with regard to future expectations, at least one of demand, supply, or also money/liquidity. Contango is a projected imbalance which leaves the global system facing realistic prospects of being overwhelmed with too much oil. Back during 2014’s crude crash, Economists and...

Read More »

This Is A Big One (no, it’s not clickbait)

Stop me if you’ve heard this before: dollar up for reasons no one can explain; yield curve flattening dramatically resisting the BOND ROUT!!! everyone has said is inevitable; a very hawkish Fed increasingly certain about inflation risks; then, the eurodollar curve inverts which blasts Jay Powell’s dreamland in favor of the proper interpretation, deflation, of those first two. Twenty-eighteen, right? Yes. And also today. Quirky and kinky, it doesn’t seem like a lot,...

Read More »

The ‘Growth Scare’ Keeps Growing Out Of The Macro (Money) Illusion

When Japan’s Ministry of Trade, Economy, and Industry (METI) reported earlier in November that Japanese Industrial Production (IP) had plunged again during the month of September 2021, it was so easy to just dismiss the decline as a product of delta COVID. According to these figures, industrial output fell an unsightly 5.4%…from August 2021, meaning month-over-month not year-over-year. Altogether, IP in Japan is down just over 10% since June, nearly 11% since...

Read More »

What Does Taper Look Like From The Inside? Not At All What You’d Think

Why always round numbers? Monetary policy targets in the post-Volcker era are changed on even terms. Alan Greenspan had his quarter-point fed funds moves. Ben Bernanke faced with crisis would auction $25 billion via TAF. QE’s are done in even numbers, either total purchases or their monthly pace. This is a messy and dynamic environment, in which the economy operates out of seeming randomness at times. Yet, here we have something that is “quantitatively” determined...

Read More »

Bill Issuance Has Absolutely Surged, So Why *Haven’t* Yields, Reflation, And Other Good Things?

Treasury Secretary Janet Yellen hasn’t just been busy hawking cash management bills, her department has also been filling back up with the usual stuff, too. Regular T-bills. Going back to October 14, at the same time the CMB’s have been revived, so, too, have the 4-week and 13-week (3-month). Not the 8-week, though. Of the first, it’s been a real tsunami at this tenor, too. Up to early August, Treasury had regularly (weekly) sold $40 billion in one-month paper. From...

Read More »

The Enormously Important Reasons To Revisit The Revisions Already Several Times Revisited

Extraordinary times call for extraordinary commitment. I never set out nor imagined that a quarter century after embarking on what I thought would be a career managing portfolios, researching markets, and picking investments, I’d instead have to spend a good amount of my time in the future taking apart how raw economic data is collected, tabulated, and then disseminated. Yet here we are. I’m not saying, nor have I ever alleged, the government is cheating, cooking the...

Read More »

Short Run TIPS, LT Flat, Basically Awful Real(ity)

Over the past week and a half, Treasury has rolled out the CMB’s (cash management bills; like Treasury bills, special issues not otherwise part of the regular debt rotation) one after another: $60 billion 40-day on the 19th; $60 billion 27-day on the 20th; and $40 billion 48-day just yesterday. Treasury also snuck $60 billion of 39-day CMB’s into the market on the 14th to go along with the two scheduled 119-day CMB’s during this period. That’s a quick $220 billion...

Read More »

An Anti-Inflation Trio From Three Years Ago

Do the similarities outweigh the differences? We better hope not. There is a lot about 2021 that is shaping up in the same way as 2018 had (with a splash of 2013 thrown in for disgust). Guaranteed inflation, interest rates have nowhere to go but up, and a certified rocking recovery restoring worldwide potential. So said all in the media, opinions written for everyone in it by none other than central bank models. It was going to be awesome. Straight away, however,...

Read More »

The Curve Is Missing Something Big

What would it look like if the Treasury market was forced into a cross between 2013 and 2018? I think it might be something like late 2021. Before getting to that, however, we have to get through the business of decoding the yield curve since Economics and the financial media have done such a thorough job of getting it entirely wrong (see: Greenspan below). And before we can even do that, some recent housekeeping at the front of the curve where bill lives. Treasury...

Read More »