That was fast. Just yesterday I said watch out for when the oil curve flips from backwardation to contango. When it does, that’s not a good sign. Generally speaking, it means something has changed with regard to future expectations, at least one of demand, supply, or also money/liquidity. Contango is a projected imbalance which leaves the global system facing realistic prospects of being overwhelmed with too much oil. Back during 2014’s crude crash, Economists and central bankers tried to claim steeper contango then was the product of supply – as if the futures market hadn’t been anticipating the US shale production. No sir. Late 2014 like again in late 2018, each curve distortion into contango had been from the demand as well as money side; as in, markets
Topics:
Jeffrey P. Snider considers the following as important: 5.) Alhambra Investments, bonds, Crude Oil, currencies, Deflation, dollar exchange value, economy, Featured, Federal Reserve/Monetary Policy, Markets, newsletter, T-Bills, tight money, U.S. Treasuries, US dollar, WTI, Yield Curve
This could be interesting, too:
Nachrichten Ticker - www.finanzen.ch writes Die Performance der Kryptowährungen in KW 9: Das hat sich bei Bitcoin, Ether & Co. getan
Nachrichten Ticker - www.finanzen.ch writes Wer verbirgt sich hinter der Ethereum-Technologie?
Martin Hartmann writes Eine Analyse nach den Lehren von Milton Friedman
Marc Chandler writes March 2025 Monthly
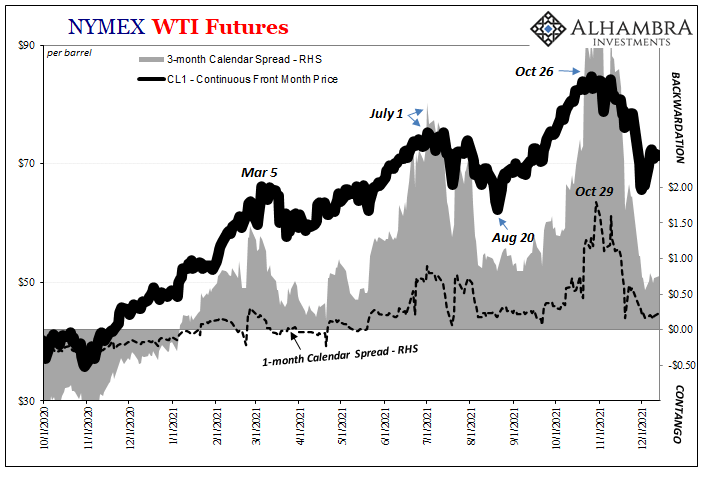
| That was fast. Just yesterday I said watch out for when the oil curve flips from backwardation to contango. When it does, that’s not a good sign. Generally speaking, it means something has changed with regard to future expectations, at least one of demand, supply, or also money/liquidity.
Contango is a projected imbalance which leaves the global system facing realistic prospects of being overwhelmed with too much oil. Back during 2014’s crude crash, Economists and central bankers tried to claim steeper contango then was the product of supply – as if the futures market hadn’t been anticipating the US shale production. No sir. Late 2014 like again in late 2018, each curve distortion into contango had been from the demand as well as money side; as in, markets looking ahead and figuring demand for oil was going to materially disappoint. In both cases, it did. So, yesterday I said watch out for WTI contango. OK, so that’s not what hit today. Even though it wasn’t the US futures benchmark curve which found itself modestly upset, this was still a major crude twist all the same. Europe’s Brent futures curve, if only at the very front, it flipped out from backwardation by the tiniest sliver.
|
|
| Bigger oversupply makes it sound like 2014’s absurd “supply glut” excuse when the issue is clearly demand more than anything (except tight money; you can’t easily finance crude storage if it becomes too expensive to borrow, so dump crude today and upend the curve before that happens). A price/curve projected surplus is about demand not measuring up. Again.
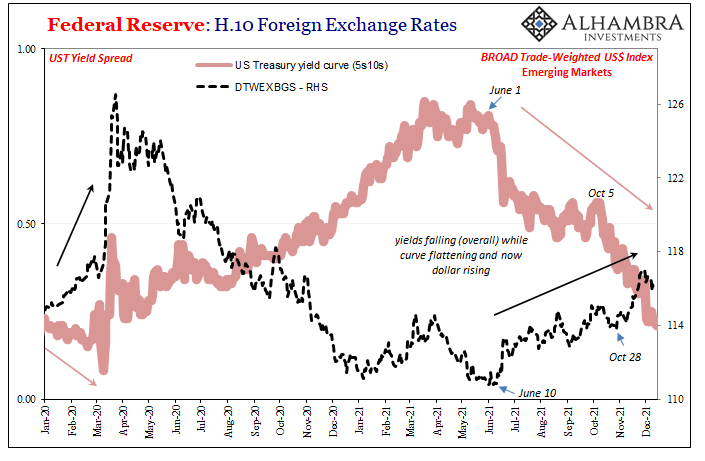
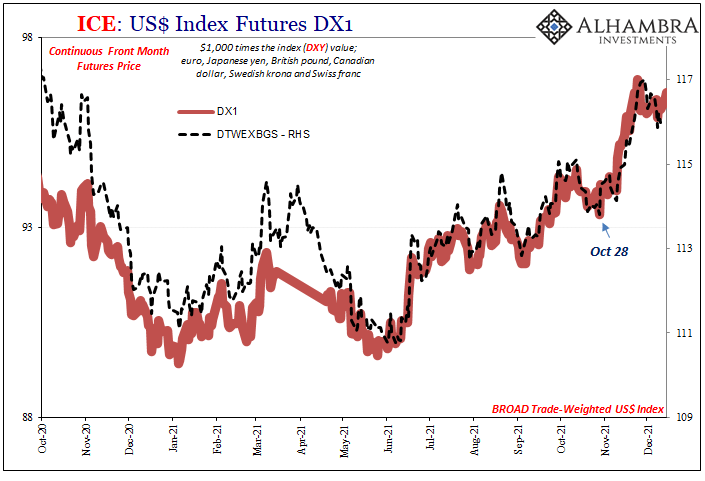
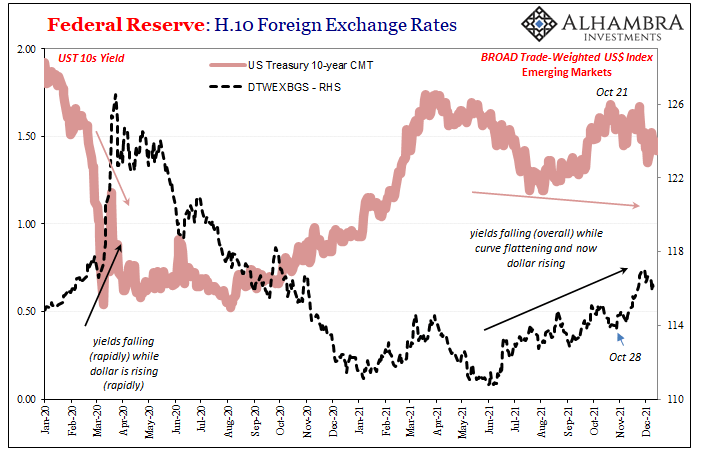
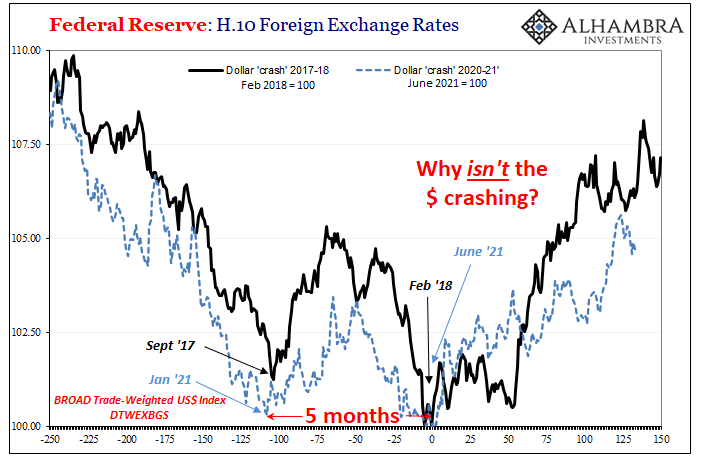
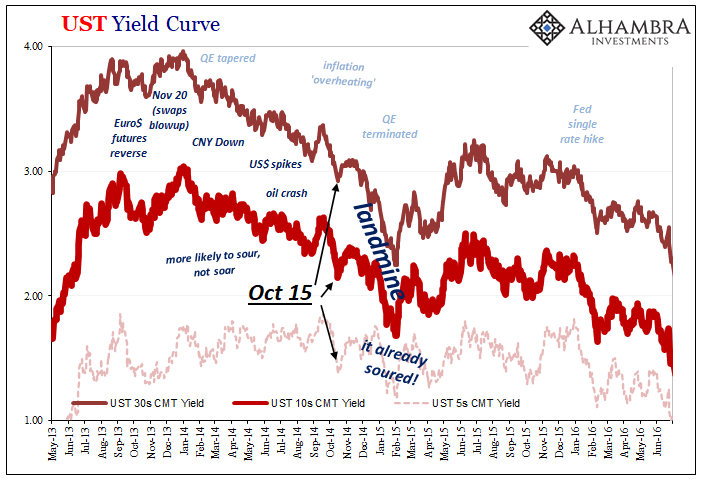
In other words, the growing “growth scare” has made its presence known in European oil like it has been in European bonds. No surprise, the European economy (Germany, in particular) has practiced the past half decade of leading the world’s downward slides. This is not, also contrary to the assertion made above, a pandemic issue; certainly not omicron. All these things go back much farther than the end of November. As I showed yesterday with WTI’s dramatic flattening, the timing is way before the latest corona variant had ever showed up. Brent like WTI had reached their deepest backwardation going all the way back to late October. In fact, pretty much everything goes back to late October; all the more recent twists, distortions, and upside down. What I mean is the modest reflationary rebound which now seems more the product of seasons than anything tangible, that’s been over with for a long time already. Whatever its cause, we’re now closing in on two months of rising deflationary market signals all over the place. These include the US$ which has very strongly correlated with the UST yield curve (below); also, eurodollar futures up to its inversion. |
|
| In fact, the strongest relationship – going all the way back to the start of June, therefore more than half a year already – is between the US$ (DXY or trade-weighted) and the yield curve’s dramatically flatter shape.
Is that, as the textbooks all claim, the market pricing higher “interest rates” as the Federal Reserve gains hawks? Hardly. Circling back to crude, the Fed’s stance is built from expectations that US economic activity is going to remain robust; too robust. However, that’s neither the oil market pricing structure already, nor is it the flattening yield curve (inverted eurodollar futures), both which reflect a lot more than the narrow national purview of the FOMC. So, we can’t (or shouldn’t) be blaming omicron nor non-money monetary policy. Instead, risk aversion is becoming the paramount setting across more and more markets (I’m obviously not talking about stocks) as “growth scare” refuses to dissipate. |
|
| Even Bitcoin has struggled since…October 21.
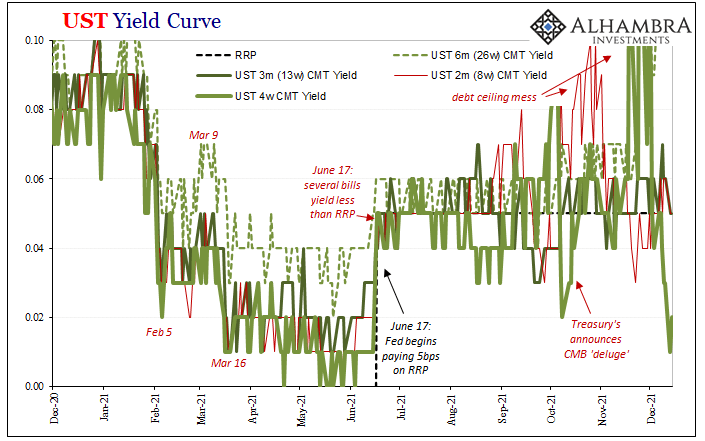
Just to add one more element to these broad, corroborating indications of monetary disease, take a look at T-bills lately. The 4-week equivalent has plunged to under 2 bps! |
|
There are others we can factor in the same way, too, including now two RRR cuts from China along with two lesser-known reserve changes to Chinese bank FX requirements (I’ll get to these at some point hopefully soon).
These things are piling up.
Even though Brent contango-d today, WTI still hasn’t so there’s some chance being considered even in the oil markets for avoiding this widely-shared downside concern. It’s just that across these market spaces that more favorable balance of probabilities is fading all the time; one by one the dominoes fall and the warnings continue to escalate.
None of it has been “unexpected.”
Tags: Bonds,Crude Oil,currencies,Deflation,dollar exchange value,economy,Featured,Federal Reserve/Monetary Policy,Markets,newsletter,T-Bills,tight money,U.S. Treasuries,US dollar,WTI,Yield Curve

