Friday , May 3 2024
Home / Tag Archives: Great Graphic (page 5)

Tag Archives: Great Graphic

Great Graphic: Treasury Holdings

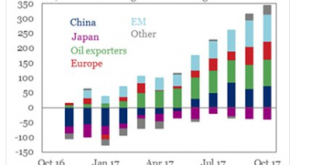
The combination of a falling dollar and rising US interest rates has sparked a concern never far from the surface about the foreign demand for US Treasuries. Moreover, as the Fed’s balance sheet shrinks, investors will have to step up their purchases. This Great Graphic was created by the Institute of International Finance (IIF). It is drawn from the US TIC data that tracks foreign holdings of US Treasuries. The most...

Read More »

Great Graphic: Euro Monthly

The euro peaked in July 2008 near $1.6040. It was a record. The euro has trended choppily lower through the end of 2016 as this Great Graphic, created on Bloomberg, illustrates. We drew in the downtrend line on the month bar chart. The trend line comes in a little below $1.27 now and is falling at about a quarter cent a week, and comes in near $1.26 at the end of February. The $1.26 area also corresponds to a 61.8%...

Read More »

Great Graphic: Progress

The world looks like a mess. While the economy appears to be doing better, disparity of wealth and income has grown. Debt levels are rising. Protectionism appears on the rise. Global flash points, like Korea, Middle East, Pakistan, Venezuela are unaddressed. At the same time, this Great Graphic tweeted by @DinaPomeranz, with a hat tip to @bill_easterly is a helpful corrective. The clear decline in hunger, poverty,...

Read More »

Great Graphic: Sterling Toys with Three-Year Downtrend Line

Summary Sterling is the second major currency this year after the euro (and its shadow the Danish krone). The downtrend line from mid-2014 is fraying. Is this the breakout? Sterling has trended higher against the dollar this year, and after the euro (and its Danish shadow), sterling is the strongest of the majors, with an 8.5% gain against the greenback. The gains have brought to to the trend line dawn off the...

Read More »

Great Graphic: Euro Pushes below November Uptrend

Summary: Euro is lower for the third day, the longest downdraft in a month and a half. It violated the November uptrend. It is testing the $1.1800 area, which houses a few technical levels (retracement, moving average and congestion). The euro is losing ground for a third consecutive session.  It is the longest losing streak since the middle of October.   The Great Graphic here, created on Bloomberg, depicts...

Read More »

Great Graphic: US 2-year Yield Rises Above Australia for First Time since 2000

Summary: The US and Australian two-year interest rates have diverged. There is scope for a further widening of the spread. Directionally the correlation between the exchange rate and the rate differentials is strong, but not stable. Near-term technicals are supportive but the move above trendline resistance is needed to confirm. The steady increase in the US two-year yield while the market unwinds rate hike...

Read More »

Great Graphic: Is that a Potential Head and Shoulders Pattern in the Euro?

Summary The euro is breaking out to the upside. The measuring objective is near $1.2150, which is near the 50% retracement of the euro’s drop from the mid-2014 high. Key caveat: It is about the upper Bollinger Band and rate differentials make it the most expensive to hold since the late 1990s. The head and shoulders pattern in technical analysis is most commonly seen as a reversal pattern. As this Great...

Read More »

Great Graphic: Euro Approaching Key Test

Summary: Euro is testing trendline and retracement objective and 100-day moving average. Technical indicators on daily bar charts warn of upside risk. Two-year rate differentials make it expensive to be long euros vs. US. Beware of small samples that may exaggerate seasonality. This Great Graphic, created on Bloomberg, shows that the euro is approaching key area.  The white trendline drawn off the September 8,...

Read More »

Canada: Monetary and Fiscal Updates This Week

Summary: Divergence between US and Canada’s two-year rates is key for USD-CAD exchange rate. Canada’s 2 hikes in Q3 were not part of a sustained tightening sequence. Policy mix considerations also favor the greenback if US policy becomes more stimulative. Many observers saw Canada as one of the canaries in the coal mine, warning that the divergence theme was over.  The Bank of Canada did hike rates twice in...

Read More »