Marc Chandler
July 17, 2018
SNB & CHF
Given that some of the retail sales that were expected in June were actually booked in May is unlikely to lead to a large revision of expectations for Q2 US GDP, the first estimate of which is due in 11 days. Before the data, the Atlanta Fed’s GDP Now projects the world’s biggest economy expanded at an annualized pace of 3.9% in Q2. If true, it would be the strongest quarterly expansion since Q3 14, when the economy...
Read More »
Marc Chandler
July 15, 2018
SNB & CHF
The Dollar Index made a marginal new high for the year at the end of June a touch below 95.55. It fell through the start of this week when it reached nearly 93.70. With the earlier gains, the Dollar Index briefly traded above the 61.8% retracement of the pullback (~94.85). A move now below 94.20 would be disappointing.
The Dollar Index is not a trade-weighted. It is too concentrated in Europe and does not include two...
Read More »
Marc Chandler
July 14, 2018
SNB & CHF
The US economy is among the strongest among the large economies. Goosed by the never-fail elixir of tax cuts and spending increases, the US economy is accelerating. Nevertheless, we continue to see the fiscal boost as short-lived, and a recent Fed paper suggested that fiscal stimulus in an upswing may not have the same multiplier as during a downturn.
Evidence of late-cycle behavior continues to accumulate. We have...
Read More »
Marc Chandler
June 1, 2018
SNB & CHF
Summary:
Euro has fallen 10.5 cents since mid-February.
Net speculative longs in the futures market remain near record.
Gross long euros have actually increased over the past month.
When one trades futures, one declares whether one has an underlying business need, in which case one is considered a commercial. If no underlying business need exists, one is classified as a non-commercial, which in the vernacular of...
Read More »
Marc Chandler
May 23, 2018
SNB & CHF
Summary:
The euro fell every day last week against the Swiss franc.
Italian political anxiety is the key development.
Speculators in the futures market got caught leaning the wrong way.
The Swiss National Bank’s decision in January 2015 to remove the cap on the Swiss franc (floor on the euro) that it has set at CHF1.20 is seared into the memory of a generation of foreign exchange participants. It is not...
Read More »
Marc Chandler
April 24, 2018
SNB & CHF
It is not that the Australian dollar is the weakest currency this month. Its 0.4% decline puts it among the better performers against the US dollar. However, it has fallen to a new low for the year today. The losses have carried to a trendline drawn off of the early 2016 low near $0.6800.
The trendline has been drawn on this Great Graphic composed on Bloomberg. It is found today near $0.7625 and rises by about seven...
Read More »
Marc Chandler
April 15, 2018
SNB & CHF
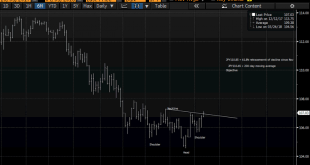
Summary:
USD has been carving out a head and shoulders pattern against the Canadian dollar.
The neckline was retested yesterday and the follow-through selling materialized today after an outside down day yesterday.
The measuring objective is near CAD1.2475.
For a little more than two weeks, we have been monitoring the formation of a possible head and shoulders top in the US dollar against the Canadian dollar....
Read More »
Marc Chandler
April 13, 2018
SNB & CHF
Today is the fifth consecutive session that the Australian dollar has weakened against the New Zealand dollar. It has now fallen to test a three-year old trendline that we show on the Great Graphic, composed on Bloomberg.
The last leg down in the Aussie actually began last October, and through today’s low, it is off by a little more than 7%. In fairness, it has really been in a broad range fro several years, roughly...
Read More »
Marc Chandler
April 7, 2018
SNB & CHF
The US dollar appears to be carving a low against the yen. After a significant fall, investor ought to be sensitive to bottoming patterns.
The first tell was the key reversal on March 26. In this case, the key reversal was when the dollar made a new low for the move (~JPY104.55) and then rallied to close above the previous session high.
The second tell was the divergence with the technical indicators. The divergence is...
Read More »
Marc Chandler
March 31, 2018
SNB & CHF
The Reserve Bank of New Zealand is credited with being the first central bank to adopt a formal inflation target. Following last year’s election, the central bank’s mandate has been modified to include full employment. To be sure this was a political decision, and one that initially saw the New Zealand dollar retreat.
The dual mandate that originated with the Fed has been questioned in the US, but Congress has shown...
Read More »
 Swiss Economicblogs.org