Marc Chandler
March 14, 2018
SNB & CHF
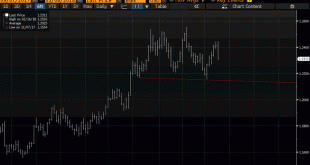
The euro appears to be potentially carving out a topping pattern. Recall that after correcting lower last September and October, the euro rallied for three months through January before weakening 1.75% in February. That was its biggest decline since February 2017.
The euro’s high print was actually on February 16 near $1.2555, when it posted a key reversal, which is when it makes a new high for the move and then closes...
Read More »
Marc Chandler
March 6, 2018
SNB & CHF
Summary:
The Canadian dollar has fallen ~7.5% against the Mexican peso this year.
Mexico has much greater political risk than Canada.
Be patient. Look for a reversal pattern nearer key support.
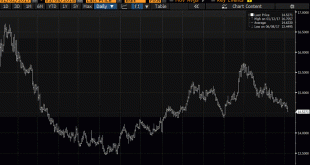
This Great Graphic composed on Bloomberg shows the Canadian dollar against the Mexican peso since the start of last year. There have been three big moves. The Canadian dollar trended lower against the peso as it corrected from...
Read More »
Marc Chandler
February 28, 2018
SNB & CHF
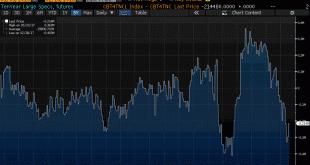
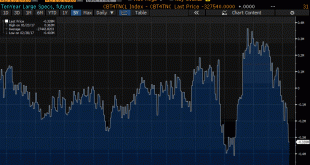
This Great Graphic from Bloomberg shows the net large speculative positioning in the 10-year note futures over the past five years. They began last year with a huge next short position of more than 400k contracts.
By May-June, the speculators had reversed themselves and were net long over 350k contracts. In the middle of December 2017, the net position was short again and peaked in early February near 327.5k contracts....
Read More »
Marc Chandler
February 21, 2018
SNB & CHF
Summary:
S&P 500 stalled near 61.8% retracement of decline.
Dow Jones Stoxx 600 stopped at 38.2% retracement.
U.S. corporate earnings growth has been much more impressive than that of Europe.
The different performance does not appear to be a function of FX rates.
Today is an important day for equities. After a sharp sell-off earlier this month, stocks staged a recovery last week. The recovery has stalled...
Read More »
Marc Chandler
February 16, 2018
SNB & CHF
Summary:
Speculators have a large net short 10-year Treasury position.
The gross short position is a record.
CPI is likely to be softer, while retail sales may show a still robust consumer.
The US reports January CPI figures tomorrow. The market seems especially sensitive to it. The main narrative is that it is an inflation scare spurred by the jump in January average hourly earnings that pushed yields higher...
Read More »
Marc Chandler
February 14, 2018
SNB & CHF
Summary:
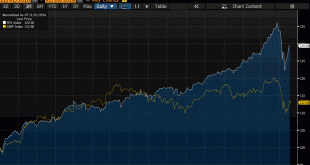
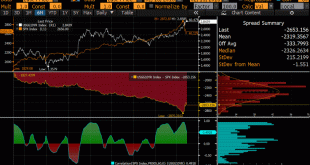
The relationship between stocks and bonds does not appear to have changed much.
It is difficult to eyeball correlations.
Question the meaning of a chart that has two time series and two scales and.
This Great Graphic comes from Bloomberg. It is a more complicated look at the relationship between the US stocks and bonds. In particular, we are looking at the S&P 500 and the 10-year US generic...
Read More »
Marc Chandler
February 9, 2018
SNB & CHF
Summary:
FX implied vol bottomed before the VIX took off.
FX vol is at the highs for the year, but euro and yen vol is lower than last September.
Sterling vol has risen the most.
With the substantial swings in the volatility of equities that have captured the imagination of journalists and punished investors who bought financial derivatives that profited from the low vol environment, we thought it would be...
Read More »
Marc Chandler
February 8, 2018
SNB & CHF
Summary:
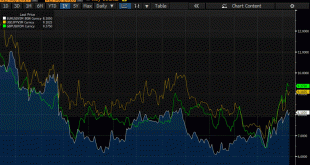
The major currencies but the Canadian dollar peaked Jan 25-26.
The Australian dollar has fallen the most since peaking.
Many are still viewing the dollar’s recovery as technical in nature and not a turn in the trend.
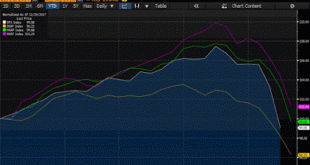
This Great Graphic was created on Bloomberg. It shows five major currencies against the US dollar this year. To avoid giving a misleading impression, the currencies are index to start...
Read More »
Marc Chandler
February 6, 2018
SNB & CHF
Summary:
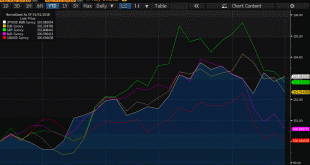
European equities peaked earlier and have fallen the furthest.
MSCI EM equities faring the best, and as of now, they are still up on the year.
MSCI Asia Pacific fell 3.4% today and is now down 0.33% for the year.
This Great Graphic was composed on Bloomberg. It shows four stock indices’ performance since the start of the year. It is indexed so that each index started the year at 100.
The yellow line...
Read More »
Marc Chandler
January 24, 2018
SNB & CHF
The Australian dollar bottomed in early December $0.7500 after having tested $0.8100 a couple of times in September. Since early December, however, the Australian dollar appreciated by nearly 6.5%. As it tested the $0.8000 area, the momentum faded.
Yesterday it managed to close above that threshold and new buying lifted it above yesterday’s highs briefly in Asia earlier today. However, there is a growing sense that...
Read More »
 Swiss Economicblogs.org