Perspective: per·spec·tive | pər-ˈspek-tiv b: the capacity to view things in their true relations or relative importance Merriam-Webster Perspective is something that comes with age I think. Certainly, as I’ve gotten older, my perspective on things has changed considerably. As we age, we tend to see things from a longer-term view. Things that seemed so important at the time, years ago, turned out to be nothing more than bumps along the road of life. That is as true in my personal life as it is in my professional one but you don’t need to hear about the former so let’s focus on the latter. I don’t view the economy through any preconceived lens. My natural state is not negative or positive but open-minded. I can’t predict how the billions of people who make up
Topics:
Joseph Y. Calhoun considers the following as important: 5.) Alhambra Investments, Alhambra Portfolios, Alhambra Research, bonds, commodities, Copper, copper/gold ratio, credit spreads, currencies, durable goods orders, economy, emerging markets, energy stocks, Featured, household wealth, inflation, inflation expectations, Interest rates, Markets, newsletter, Real estate, Russia, stocks, US Dollar Index, Yield Curve
This could be interesting, too:
Nachrichten Ticker - www.finanzen.ch writes Die Performance der Kryptowährungen in KW 9: Das hat sich bei Bitcoin, Ether & Co. getan
Nachrichten Ticker - www.finanzen.ch writes Wer verbirgt sich hinter der Ethereum-Technologie?
Martin Hartmann writes Eine Analyse nach den Lehren von Milton Friedman
Marc Chandler writes March 2025 Monthly
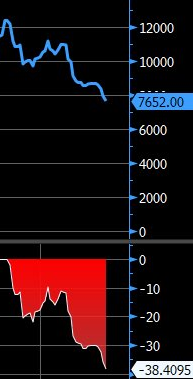
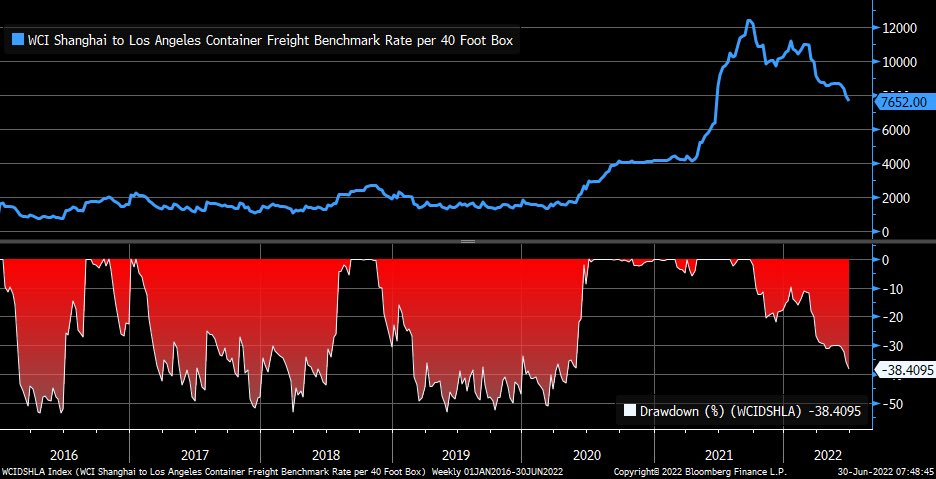
Perspective is something that comes with age I think. Certainly, as I’ve gotten older, my perspective on things has changed considerably. As we age, we tend to see things from a longer-term view. Things that seemed so important at the time, years ago, turned out to be nothing more than bumps along the road of life. That is as true in my personal life as it is in my professional one but you don’t need to hear about the former so let’s focus on the latter. I don’t view the economy through any preconceived lens. My natural state is not negative or positive but open-minded. I can’t predict how the billions of people who make up the global economy are going to behave. I can’t predict what governments will do that might impact the global economy (with some exceptions). I can’t predict the global variables that affect global trade and economic growth. For instance, I know of absolutely no one who can predict future exchange rates with any degree of accuracy. I can observe the present trend but predict where they will be six months from now? Millions of traders, hedge funds, economists of all stripes, some of the smartest people in the world have tried and failed. Yes, there are some who can point to specific instances where their views about some future economic policy proved correct and they were able to profit (Soros’s pound trade). But I don’t know of anyone who has a long-term track record that is much better than just plain luck. And most are worse. And exchange rates can have a dramatic impact on trade and a host of other factors affecting global growth. If you have a preconceived notion about the economy (negative or positive), you will see all data through that lens. You will, in the lingo of psychology, be subject to confirmation bias. You will look for things that support your view of the world. And you will also frame things in a way that allows you to maintain your views. In other words, you will lose perspective. The chart below shows the cost of shipping freight from Shanghai to Los Angeles. I have seen this or similar versions on Twitter over the last couple of weeks, always cast in a negative light. It purportedly shows a drop in demand in the US as the cost of shipping goods from China is falling rapidly. The price is down about 15% over the last year. This is confidently cited as proof of slowing demand in the US and more evidence that we are headed for recession. Note: I’m not very good with graphics so this chart doesn’t show you the dates but the starting date for the graph is roughly mid to late 2021. If you look at the entire set of data though, a different picture emerges. Yes, prices have come down but are still well above the pre-COVID level. In fact, the cost to ship from Shanghai to LA is still roughly 4 times the pre-COVID price. There could be a myriad of reasons why shipping costs have fallen recently but I have a hard time classifying this as bad news. One’s perspective certainly matters. If you are importing goods from Shanghai, this is undeniably, undoubtedly, good news. Your shipping costs just dropped by 15% year-over-year and if this downward trend continues, those costs seem likely to fall quite a bit further. |
|
| Bad news or good news? Depends on your perspective, doesn’t it? Regardless of your perspective though, this is something that had to happen. Did anyone believe that the rise in shipping costs since COVID was permanent or sustainable? The rise in shipping costs had many causes and the drop back to pre-COVID levels will too. Weaker demand may well be one of those but it will hardly be the only one. And from the perspective of an investor – except those invested in shipping stocks maybe – this is good news. Lower costs will be positive for margins and will act to offset any drop in volumes. Will it be a perfect offset? Of course not and I can’t even say whether this is a net negative or net positive right now. Long term though, lower shipping costs are most certainly a positive for global commerce.
I don’t mean to imply that the US economy isn’t slowing as it obviously is. I think though that the slowing is something that had to happen, was inevitable in fact and isn’t necessarily a bad thing. My view, for quite some time, is that once the COVID distortions are over, the economy will return to its previous state of roughly 2% growth and 2% inflation. That is based on the simple observation that we did nothing during that time to improve the factors that affect economic growth (workforce and productivity growth). The debt we added at the federal level during COVID may turn out to be a negative but it may also be offset by positive balance sheet developments at the household and state government levels. |
|
Budget Surpluses Push States’ Financial Reserves to All-Time HighsAfter an early pandemic decline, states had collectively amassed their largest fiscal cushion on record by the start of the current budget year. Higher-than-expected tax revenue—among other temporary factors—drove the total held in savings and leftover budget dollars to new highs. As states approach the close of fiscal year 2022, most expect to spend down at least a portion of their surplus funds. The Pew Charitable Trusts, May 2022 |
|
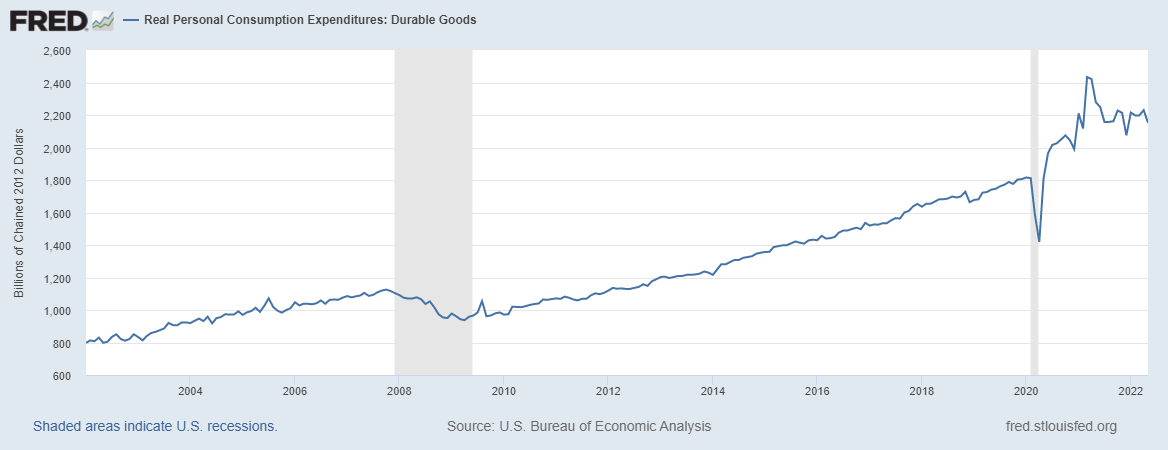
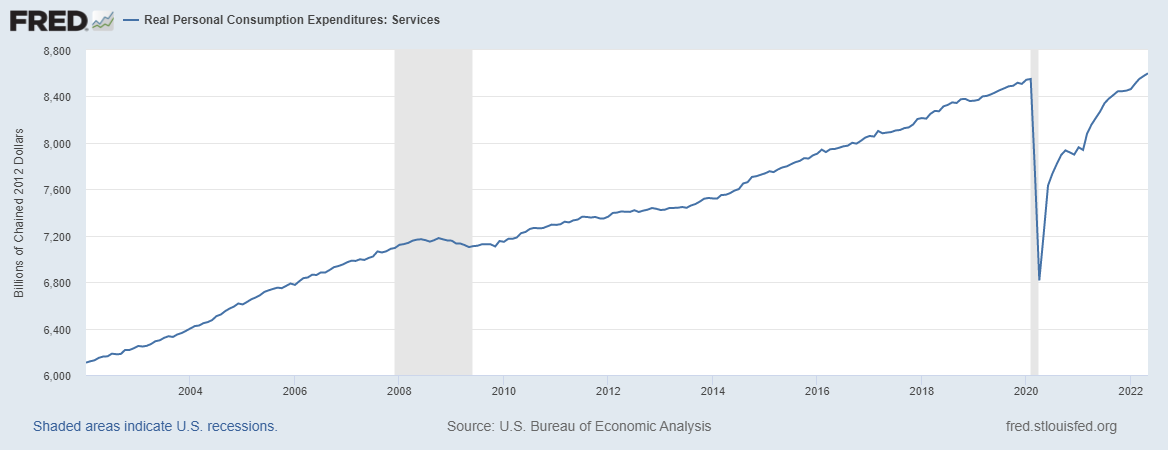
U.S. household wealth drops for first time in 2 yearsHousehold net worth edged down to $149.3 trillion from a record $149.8 trillion at the end of last year, the Fed’s quarterly snapshot of the national balance sheet showed. The drop was driven by a $3 trillion fall in the value of corporate equities – a plunge that has worsened in the current quarter – while real estate values climbed another $1.7 trillion. Still, the report showed household balance sheets overall remained healthy through the first three months of the year – some $32.5 trillion above pre-pandemic levels – and looked likely to continue to support strength in consumer spending in the face of high inflation. Of particular note, bank account balances rose, with checkable deposits and currency rising about $210 billion to $4.47 trillion, and time and savings deposits up about $90 billion to $11.28 trillion. Reuters, June 9, 2022 Even if we assume that the drop in shipping rates is a consequence of slowing demand, some perspective makes me think that this is a necessary and welcome development. The inflation we’ve experienced over the last year was driven, at least in part, by excess demand from fiscal stimulus (that was obviously unnecessary). Demand for goods – durable goods in particular – surged during COVID for many reasons. This excess demand for goods, coupled with constrained supply due to COVID restrictions, is part of the reason those shipping rates rose so dramatically. Real sales of durable goods surged throughout COVID but accelerated rapidly with stimulus payments; sales peaked right as Biden’s American Rescue Act was implemented in the spring of last year. Sales have been falling since then, down 11.6% since the peak. That is obviously a negative for the economy since the peak but if the excess demand was responsible for some portion of the rise in prices – and it certainly was – then correcting the excess demand should have a positive impact on inflation. Isn’t that what we want? While the goods economy is certainly slowing – and with good reason and potentially good effect in my opinion – the services side of the economy continues to recover from COVID. Services spending is approximately 1.6 times the size of the goods economy and 4 times the size of durable goods. |
|
| If we assume that durable goods continue to fall back to the pre-COVID trend over the next 6 months, services would have to rise at about 0.3%/month to offset the drop in goods demand. That is slightly less than the average monthly gain this year of 0.4%. Of course, durable goods orders could fall further to below trend and services spending growth could moderate but it certainly isn’t unreasonable to think that a rise in service spending could offset the drop in goods. To think that the economy is about to enter – or has already entered – a deep recession is to assume that goods spending will just keep going down and that service spending will stop rising and start falling. If you start from a negative view of the economy that’s where you end up; negative trends get extrapolated to the worst-case scenario.
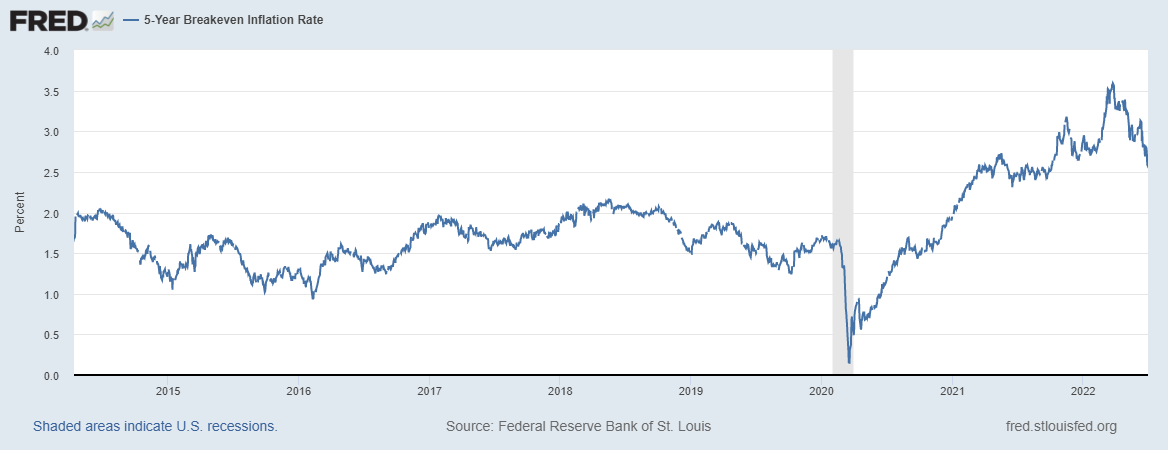
By the way, durable goods orders for May were released last week and were better than expected across the board. Core capital goods (which are durable goods) rose for the 11th month of the last 12. The drop in goods demand is having a positive impact on inflation as well. We also received data on personal income and consumption last week which included the Fed’s preferred inflation gauge. The headline year-over-year change in the PCE price index was 6.3% the same as last month and down from the peak of 6.6% in March. The core PCE price index (what the Fed is watching) year-over-year change was 4.7%, down from 4.9% last month and the peak of 5.3% in February. We also saw a big drop in inflation expectations last week. The 10-year breakeven inflation rate fell to 2.34%, 5-year breakevens fell to 2.6% and 5-year, 5-year forwards fell to 2.08%. The track record of inflation expectations as a predictor of future inflation is pretty poor but it does show that investors’ fears of inflation are fading fast and I think for good reason. |
|
| There are a wide array of economic data series that are returning to their pre-COVID trends, just as we’ve been expecting. It is possible that in doing so, some of these will overshoot and produce a more negative outcome. But these reversions are exactly what we need to have a more healthy economy. It isn’t healthy for demand to be stoked to a degree that it outstrips supply and raises prices for everyone. It isn’t healthy for house prices to keep rising at 20% per year. The recent softening in asking prices and inventories rising to levels that are still half of the pre-COVID norm are not terrible outcomes. Will returning to pre-COVID trends produce a contraction in real GDP that will be called a recession? Maybe.
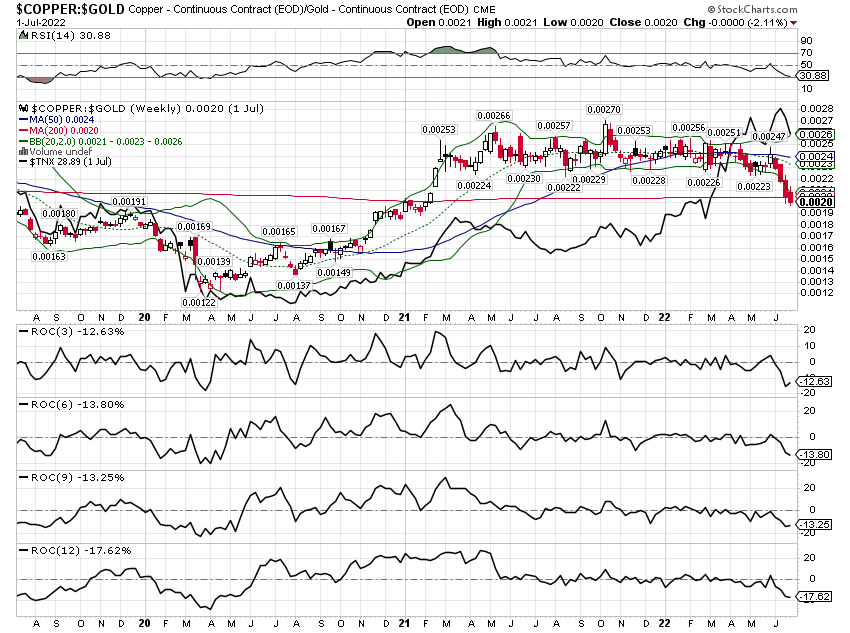
But assuming that the outcome is some kind of 2008-style financial crisis is just assuming way too much knowledge about the future for me. A little perspective can provide much-needed clarity about the present state of the economy. The rising rate, rising dollar environment has changed but only slightly. The 10-year Treasury yield is down over the last month. That is not sufficient for us to make big changes to our portfolios but a small change may be warranted. The yield did break a short-term uptrend last week and it seems likely that rates will continue to pull back to the targets I mentioned in the mid-year update. Confirmation of this trend is found in the copper/gold ratio which tracks the 10-year yield pretty closely: |
|
| I’ve seen a lot of commentary recently about the decline in copper prices also being an indication of recession. While the copper/gold ratio is a pretty good indicator for long-term rates, it isn’t a very good recession indicator. And copper, by itself, is basically useless as a recession indicator. Copper fell from $4.50 to under $2 from 2011 to 2016. If you don’t remember a recession during that time, it’s because we didn’t have one. It fell from $1.46 to $0.60 from 1995 to 1999. You won’t find a recession there either. As for the copper/gold ratio, there have been 6 recessions since 1980 and only two of them came after a significant fall in the ratio. Based on history, you might even start to think that lower copper prices are actually a positive for the economy if not for copper producers. Imagine that. Lower input costs are positive for economic growth. | |
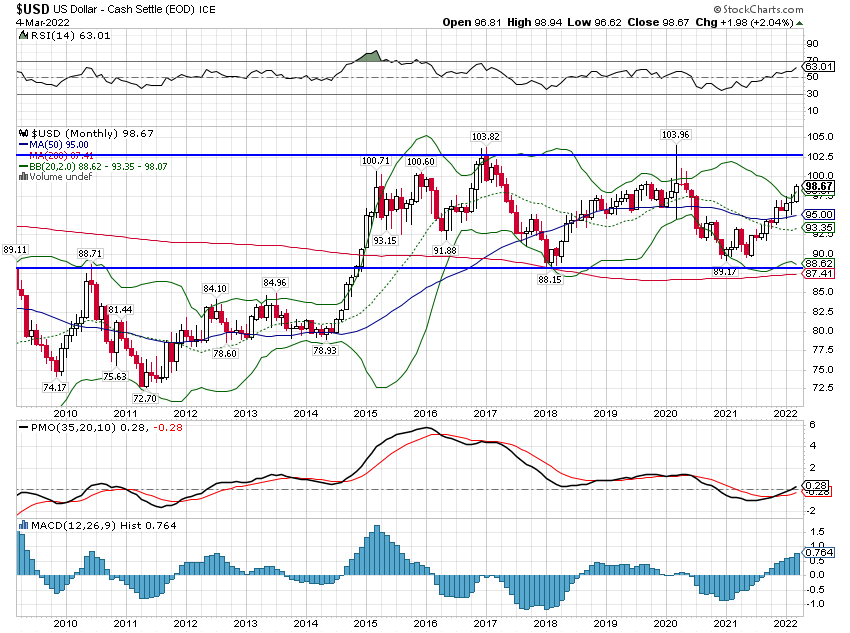
| As for the dollar, it remains fairly strong but I think perspective here might be useful too. It is true that the dollar index is up about 10% this year and 17% from last year’s low. It is also true that it is up 15% since the beginning of 2015 and is essentially unchanged from the beginning of 2017. The emerging market dollar index is up less than 3% this year and a total of 1.6% since January 2017. The strength of the dollar this year is mostly a consequence of Yen weakness. That would appear to be more about Japan than the rest of the world but if you are worried about it, there is an easy hedge. If you think further Yen weakness could cause a problem, short the Yen. If you think a reversal of the Yen weakness could cause some problems, buy some Yen. It is interesting that the opinions I’ve read seem to be about evenly split as to which outcome would be worse for the global economy. If you had doubts about the depth of pessimism on the global economy, that ought to clear it up. A rising Yen and a falling Yen are both reckoned to be negative for global growth and financial markets depending on who you talk to.
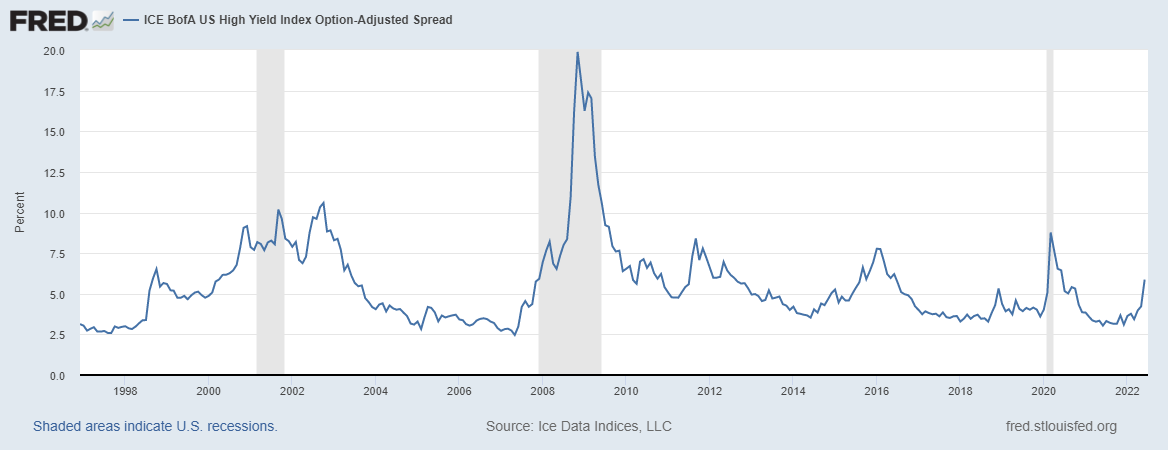
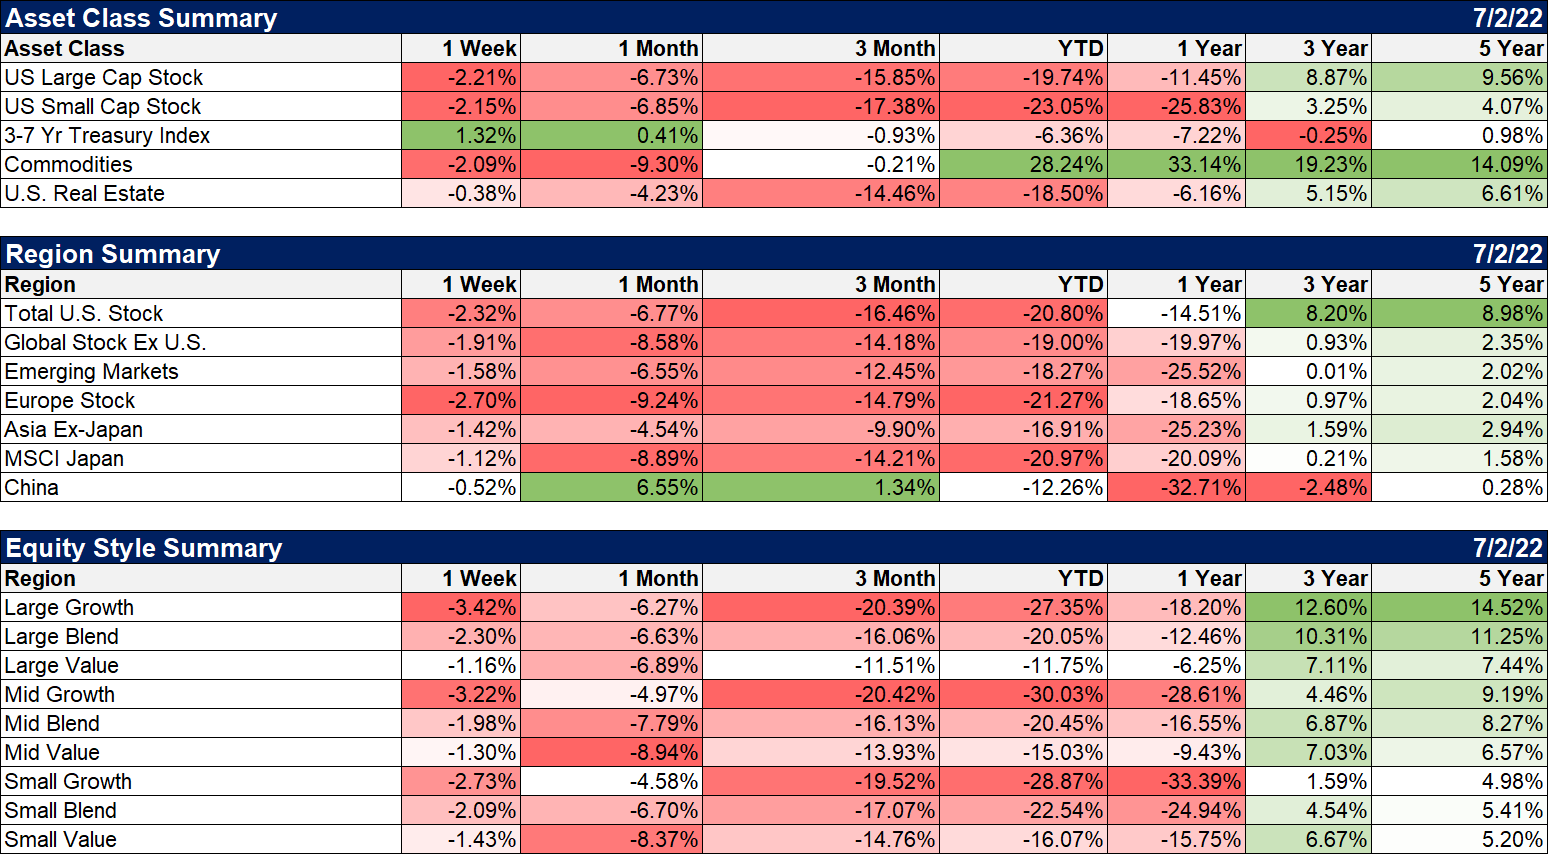
We are likely to extend the duration of our bond portfolio again soon, an acknowledgment of slightly weaker economic conditions. Stocks were down again last week but the bond rally helped balanced accounts for a change. A 60/40 portfolio of Vanguard Total Stock market and Vanguard Total Bond market was down about 1.4% last week or, as you might guess, about 60% of the drop in stocks. Our moderate portfolios were about flat last week, some down a fraction of 1% and some up a fraction. More conservative accounts were up on the week as our recent extension of duration paid off. If we are indeed moving toward recession of some kind, we will likely continue to extend duration. I don’t think, right now, that we will expand our bond allocation beyond the strategic mandate but it is still possible depending on how the economy develops. My biggest concern right now continues to be credit spreads which widened slightly last week. |
|
| Spreads have now moved above the 2018 highs but are still well below the 2016 peak (which didn’t end in recession). This isn’t, by itself, a recession signal but it is increasingly uncomfortable. On the other hand, higher rates for lower-rated borrowers, after a period of very easy money, might not be a bad thing in the end. Maybe it shouldn’t be so easy to issue junk bonds as it has the last few years. Another one of those things that needed to happen? Maybe, but recession is a harsh way to impose discipline on lending. | |
| The winners last week were, not surprisingly, mostly in the defensive areas, energy an exception. Real estate was down but did outperform with rates falling.
There seems to be a rush to buy the dip in the energy sector but I’d be patient. I think crude has more downside with a target in the mid to high 80s. |
|
| The yield curve flattened a little last week and remains very nearly flat at 4 basis points on the 10/2 spread. 2-year yields have fallen 2 basis points more than the 10-year since their respective peaks so the entire curve is shifting lower. That is an indication of reduced nominal growth expectations but most of that has been in the form of falling inflation expectations. What would worry me a lot more is if the 2-year yield starts to drop at a much faster rate than the 10-year. That would add urgency to the slowdown fears and likely require a portfolio response.
Right now, futures market continues to point to the first half of next year as the peak in rates around 3.3% on Fed Funds. That changes by the day as new information is incorporated into the market. A couple of months ago, the peak wasn’t expected until sometime around the beginning of Q4 2023. Note: By the way, I am using SOFR futures rather than Eurodollar futures now since open interest in Eurodollar contracts is fading. |
There are plenty of things for investors to worry about, most of them things we can’t do anything about. We don’t know how the Ukraine war will develop or what Russia might do with regard to natural gas flows to Europe. Will Russia shut down all gas flows to Europe? Europe is on the verge of recession already and a complete cut-off of gas would certainly finish the job. But there are no free lunches out there. I can think of several ways to hedge that event but they are costly upfront or costly in the future if that isn’t how things unfold. Predicting geopolitical events is even harder than economic events and I don’t know of any way to improve the odds. If you start hedging geopolitical outcomes you will never stop; there’s always something bad happening somewhere in the world.
Risks always exist but gaining some perspective can reduce your anxiety level. Yes, we know the US economy – the global economy – is slowing. That isn’t news anymore. What we are debating in markets right now is the rate of change and the depth of any slowing. Has the market already priced in the worst of what is to come? With sentiment as negative as it is, that may well be the case. I’ve been in markets for 40 years and there have only been a couple of times when the pessimism was as thick as it is today. 2008 and 2020 stand out in my mind because the uncertainty of those situations was so extreme. In 2008 we didn’t know if the banking system would survive and in 2020 we didn’t know if we would. Those are pretty dire circumstances. Is today comparable to 2008? I don’t think so and I don’t think I’m being some blind optimist for saying so; the banking system is not at risk. Is it comparable to 2020 when a large chunk of the economy was shut down by government fiat? Um, no, not even close.
The vast majority of the fall in stocks this year had nothing to do with fears of a slowing economy. In fact, the drop was much more about the rise in interest rates which was driven by inflation fears. Now that inflation fears are fading rapidly and interest rates are coming back down, the bearish argument has shifted to economic slowing. It seems there is no way to escape the clutches of the bears. That is exactly how sentiment about the economy and markets feels today, a lose/lose situation. I think that is a consequence of the last two recessions being so severe; investors are so scarred and scared, afraid that the worst-case scenario is going to happen again, that they can’t put things in perspective. But history says that it is times like this, when things feel the bleakest that one ought to be searching for opportunities. It is hard to do but a little perspective helps. Zoom out and the big picture isn’t nearly so frightful.
Tags: Alhambra Portfolios,Alhambra Research,Bonds,commodities,Copper,copper/gold ratio,credit spreads,currencies,Dollar Index,durable goods orders,economy,Emerging Markets,energy stocks,Featured,household wealth,inflation,inflation expectations,Interest rates,Markets,newsletter,Real Estate,Russia,stocks,Yield Curve

