The Battle Royale: Stocks vs. Bonds. The S&P 500 is at valuations higher than those in 1929 and rival those of 1999. Despite a recession, the index is 25% above where it was trading before the pandemic. The equity stampede is undoubtedly bullish about corporate earnings prospects and, by default, economic growth. As the stock bulls party, bond investors are glum about future economic prospects. Bond yields are below where they were before the pandemic started. Current yields warn of paltry economic growth and little inflation in the future. Who has it right? (My colleague Lance Roberts touched on this issue in this past weekend’s newsletter.) Flipping Valuations Traditional equity valuation analysis frequently involves the comparison of a fundamental metric to
Topics:
Michael Lebowitz considers the following as important: 9) Personal Investment, 9a.) Real Investment Advice, Featured, Investing, newsletter
This could be interesting, too:
Nachrichten Ticker - www.finanzen.ch writes Die Performance der Kryptowährungen in KW 9: Das hat sich bei Bitcoin, Ether & Co. getan
Nachrichten Ticker - www.finanzen.ch writes Wer verbirgt sich hinter der Ethereum-Technologie?
Martin Hartmann writes Eine Analyse nach den Lehren von Milton Friedman
Marc Chandler writes March 2025 Monthly
The Battle Royale: Stocks vs. Bonds.
The S&P 500 is at valuations higher than those in 1929 and rival those of 1999. Despite a recession, the index is 25% above where it was trading before the pandemic. The equity stampede is undoubtedly bullish about corporate earnings prospects and, by default, economic growth.
As the stock bulls party, bond investors are glum about future economic prospects. Bond yields are below where they were before the pandemic started. Current yields warn of paltry economic growth and little inflation in the future.
Who has it right? (My colleague Lance Roberts touched on this issue in this past weekend’s newsletter.)
Flipping Valuations
Traditional equity valuation analysis frequently involves the comparison of a fundamental metric to share price. The result is often interpreted as quantifying the richness or cheapness of the numerator in the ratio. In the case of the more popular metrics like P/E or P/BV, that is price.
By assuming the price is fair, we can reverse traditional logic and calculate what the market implies for the denominator.
For example, assume the P/E ratio on XYZ stock jumps to 20 after lingering around 10 for decades. With this knowledge, we can make one of two assumptions.
- The price of XYZ is twice as high as it should be
- XYZ’s earnings are going to grow at twice the historical rate in the future.
The first bullet point assumes XYZ’s price must decline to bring its valuation to fair value. The second bullet point assumes XYZ’s earnings must increase to get its valuation to fair value.
The Peak ConceptBefore diving in, it’s important to note we use peak earnings and peak GDP throughout this analysis. Peak means we use the highest level of earnings or GDP at each point in time. This method helps eliminate anomalies and better focus on more durable trends. For example, the current peak earnings per share of the S&P 500 is $139.47/share, the highwater mark from 2019. The current level is $94.14. The peak P/E is only 26.50, as compared to the actual P/E of 39. The graph below compares peak S&P 500 earnings per share to actual earnings per share. As shown, peak earnings reduce volatility and better focus on the trend. |
Peak S&P Earnings vs Actual Earnings, 1980-2020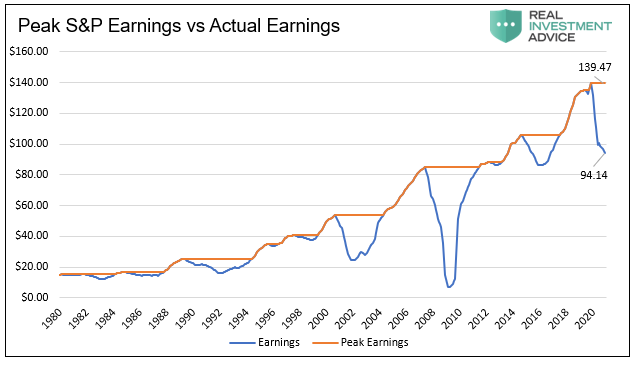 - Click to enlarge |
S&P Earnings ExpectationsTo calculate the implied growth rates of future earnings and economic activity, let’s look at the peak P/E of the S&P 500 and assume its price S&P 500 is fairly valued. The following graph compares the secular peak earnings growth rate (blue) to the secular peak GDP growth rate. There are two important takeaways.
|
Peak Earnings Growth and Peak GDP Growth, 1980-2020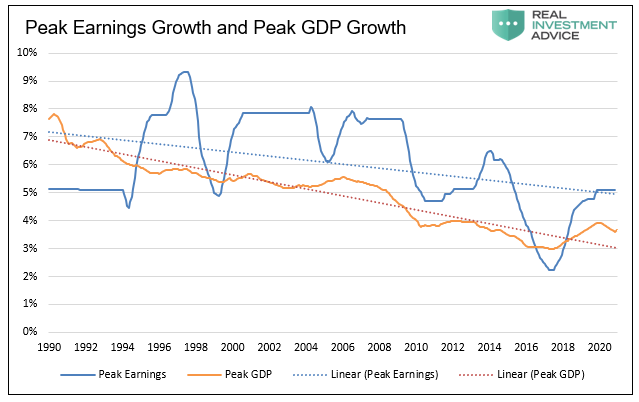 - Click to enlarge |
| So, with an understanding of economic and earnings growth trends, we have context for comparison to market expectations.
Based on the current peak P/E versus the 20-year average and assuming the price is fair, the market implies earnings growth for the next ten years of 7.17%. By looking at the graph above, we can see it is more than 2% above the trend. The following graph compares implied earnings growth (black) to the trend earnings growth shown(blue). The current and historical difference is highlighted in red and green. Stock investors are betting that earnings growth (blue) will accelerate markedly and reverse the multiple decade-long trends. Such implies that GDP growth rates will also turn up. It is worth highlighting the cyclicality of earnings forecasting errors, as shown in red and green. Periods in which forecasts were higher than actual earnings are often followed by periods where the market underestimates earnings. We remind you: “Periods in which equities are overpriced with high valuations are followed by periods with lower returns. Conversely, periods when stocks are cheap, are often followed by periods of strong returns.” From our article: Are You Playing Roulette With Your Retirment? |
Peak Earnings and Peak Implied Earnings, 1980-2020 - Click to enlarge |
BondsBond yields, like corporate earnings, track nominal GDP exceptionally well. Assessing what bond yields tell us about implied future growth is straightforward as we directly compare yields to peak GDP growth rates. The graph below shows the significant statistical correlation between 10-year bond yields and 10-year nominal GDP growth. As represented by the green dot, the current ten-year yield is 1.72%, and the ten-year nominal GDP growth rate is 3.71%. The bond market currently implies sub 2% GDP growth, well below the current trend. Bond yields expect the decades-long trend lower in GDP growth to continue. By default, bond investors forecast earnings growth will continue to trend downward. |
Correlation - 10yr UST 7 10-yr GDP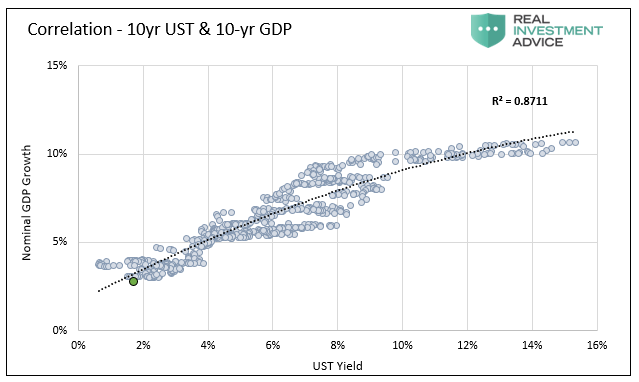 - Click to enlarge |
Place Your Bets – Bonds
Bond yields argue for longer-term economic trends continuing. Stock prices imply earnings and economic growth will accelerate meaningfully, reversing long-term trends.
Supporting the bond market’s view are the macroeconomic headwinds we frequently discuss. For economic growth rates to rise, we need to see productivity and or demographic trends reverse.
Barring a significant reversal of immigration policy, demographics will continue to contribute less to economic growth. In fact, the Census Bureau just announced the U.S. population grew at its slowest rate since the 1930s, and prior to that, the late 1700s. They attribute the decline to low rates of immigration and births.
Productivity growth depends on capital expenditures, education, employee training, and new technologies. There are few signs spending in these areas is occurring at any greater rate than it has in the past decade. Worse, COVID-related stimulus and related spending point to a surge in non-productive debt and consumption. The additional non-productive debt burden will further hamper productivity growth.
Unfortunately, the recent surge in the amount of debt is likely to do little for future growth. As Lance Roberts discussed, “Debt Doesn’t Create Growth.”
“More debt doesn’t lead to more robust economic growth rates or prosperity. Since 1980, the overall increase in debt has surged to levels that currently usurp the entirety of economic growth. With economic growth rates now at the lowest levels on record, the change in debt continues to divert more tax dollars away from productive investments into the service of debt and social welfare.”
Place Your Bets Stocks
While the equity bulls must contend with well-established trends, they do have a couple of cards up their sleeve. For starters, the nation runs a $4 trillion annual deficit which is significantly boosting economic activity. While more debt will impede longer-term growth, fiscal stimulus will flow through to corporate earnings for the time being. Further, it’s not unreasonable to think that massive deficits will continue well beyond the end of the pandemic.
Second, the Fed seems intent on generating inflation. If they do, earnings will be boosted artificially by inflation. However, valuations tend to shrink in inflationary periods, which may not be so bullish for stock prices.
Summary
Our bet is with the bond investors. Earnings will recover as spurts of temporary inflation and massive fiscal spending ripple through corporate income statements. However, the fiscal and monetary pandemic response only strengthens our resolve that economic growth rates will continue to trend lower.
The only difference between the response to the 2008 financial crisis is the government and Fed did more of it this time. The economic growth rate following the financial crisis was weaker than the prior expansion. Given the same stimulus playbook is being used, albeit to a more considerable degree, we can only assume the results will be similar.
You Might Also Like
 Seth Levine: Bitcoin Doesn’t Fix Defi, Defi Fixes Bitcoin
2021-05-02
Does Bitcoin Fix Defi (Definancialization)? “Bitcoin fixes this.” I cringe every time I see this popular meme. I find it worse than nails on a chalkboard. Bitcoin and other cryptocurrencies (crypto) supporters seem to wheel this tired trope out for every problem they see, particularly at economic ones. To their credit, they genuinely want to fix the financial system’s problems.
 Weekly SNB Sight Deposits and Speculative Positions: SNB buying euros at high prices
2021-04-26
Update April 26 2021: SNB intervening. Sight Deposits have risen by +0.2 bn CHF, this means that the SNB is intervening and buying Euros and Dollars: The change is +0.2 bn. compared to last week.
 How to file your taxes with Swiss and foreign securities
2021-03-04
One question I get often is how to file taxes with stocks and dividends. And this especially gets popular when we add foreign stocks and foreign dividends into the mix. Many people are afraid of investing because they think it will make it complicated to file your taxes. But in practice, it is not complicated to file your taxes even with a large ETF portfolio.
 A Major Support For Asset Prices Has Reversed
2020-12-24
In 2019, we wrote about how corporate share repurchases, or “stock buybacks,” had accounted for nearly all buying in the market. A year later, that significant support for asset prices has reversed.
 The Simple Path to Wealth Book Review
2020-12-11
I have recently ordered a few more non-fiction books, and I have just finished The Simple Path To Wealth. This book was on my reading list for a very long time. The Simple Path To Wealth, by Jim L. Collins, is about investing simply to amass enough money to reach Financial Independence.
 Free by 40 in Switzerland – Book Review
2020-11-27
I just finished reading Free by 40 in Switzerland, a book about financial independence, in Switzerland, by fellow blogger Mr. Mustachian Post, alias Marc Pittet. Mr. MP was kind enough to send me a version that I could review before the release date. So I can have this review ready now that the book is available!
 The 4 Stages of Wealth
2020-11-25
During your financial life, you will go through several stages of wealth. Maybe you have already crossed several of them, or maybe you are at the first stage of wealth. Regardless of where you are, it is important to know what is ahead and prepare for your future stages of wealth. There are many things you can do to prepare your future financial stages.
2020-11-20
Investing is incredibly hard. Mapping observations to security price movements are complex. Often, the relationships governing these moves are unknown. Yet, this is the investor’s task. I’ve used this blog as a tool for exploring some of these connections. It’s been incredibly rewarding.
Tags: Featured,Investing,newsletter