We’re changing the format on our Macro updates, breaking the report into two parts. This is part one, a review of the data released the previous month with charts to highlight the ones we deem important. We’ll post another one next week that will be more commentary and the market based indicators we use to monitor recession risk. We are still playing catch up on the economic data releases due to the government shutdown so a lot of the data released in the last month is from November and December. It isn’t really news anymore but some of it is interesting. Overall, the data supports what we’ve been reporting and expecting for months – the economy is slowing but does not look recessionary. We continue to expect the
Topics:
Joseph Y. Calhoun considers the following as important: 5) Global Macro, Alhambra Research, capital goods orders, Construction, economy, factory orders, Featured, industrial production, inflation, inventory to sales ratio, manufacturing, Monthly Macro Monitor, newsletter, Personal Income, Retail sales, savings rate, sentiment, The United States, trade
This could be interesting, too:
Nachrichten Ticker - www.finanzen.ch writes Die Performance der Kryptowährungen in KW 9: Das hat sich bei Bitcoin, Ether & Co. getan
Nachrichten Ticker - www.finanzen.ch writes Wer verbirgt sich hinter der Ethereum-Technologie?
Martin Hartmann writes Eine Analyse nach den Lehren von Milton Friedman
Marc Chandler writes March 2025 Monthly
We’re changing the format on our Macro updates, breaking the report into two parts. This is part one, a review of the data released the previous month with charts to highlight the ones we deem important. We’ll post another one next week that will be more commentary and the market based indicators we use to monitor recession risk.
We are still playing catch up on the economic data releases due to the government shutdown so a lot of the data released in the last month is from November and December. It isn’t really news anymore but some of it is interesting. Overall, the data supports what we’ve been reporting and expecting for months – the economy is slowing but does not look recessionary. We continue to expect the economy to slow back to the long term trend of around 2% growth. It is possible, maybe even likely, that there will be an overshoot to the downside so a GDP print with a one handle shouldn’t be a cause for alarm.
Economic Reports
Economic Growth & Investment |
Economic Growth and Investment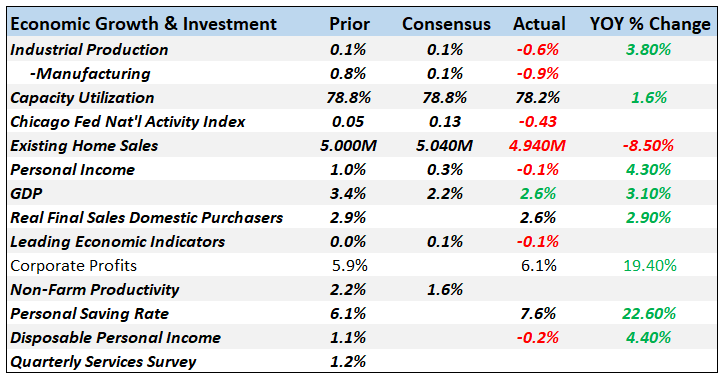 - Click to enlarge |
| Several items stand out in this section. Industrial production was down 0.6% in January with manufacturing leading the way down. But that comes after a nice gain in manufacturing for December. The big swing was in vehicles, down 8.8% in January after being up 4.3% in December. No, I don’t have an explanation for the swings but lots of weird things happen at year end. In any case, IP looked lousy but at 3.8% year over year change that is about average for this expansion and way above anything that is cause for concern. |
U.S. Industrial Production, Jan 2004 - 2019(see more posts on U.S. Industrial Production, )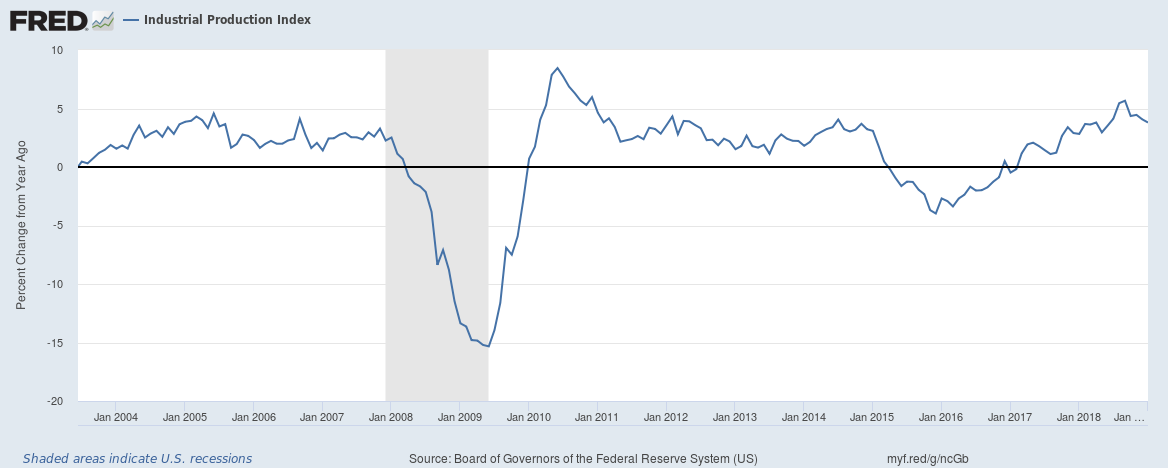 - Click to enlarge |
| Personal income was down 0.1% in January but that comes after a full 1% rise in December. Again, there is no big change here. Income growth this cycle has been less than previous cycles but it has also been steady.
You’ll notice too that the savings rate was up quite a bit, a remainder from higher income and lower consumption. I think that is primarily an artifact of the stock market correction and the government shutdown. Based on the spike in the savings rate and the fall in consumer sentiment, it appears individuals were quite concerned with things in December. The GDP report for Q4 was pretty solid and better than I expected. Some of that was inventory building – unintentional I think – but there was also a nice jump in investment spending. Residential investment though was negative again and the real estate markets continue to be an area of concern. Existing home sales were down 8.5% year over year in January and inventory is rising. Median prices were down as well, another indication of weak demand. As I’ve said before though, the housing market is a lot smaller than it once was and has a smaller impact on the overall economy. |
U.S. Personal Income, 1994 - 2018(see more posts on U.S. Personal Income, )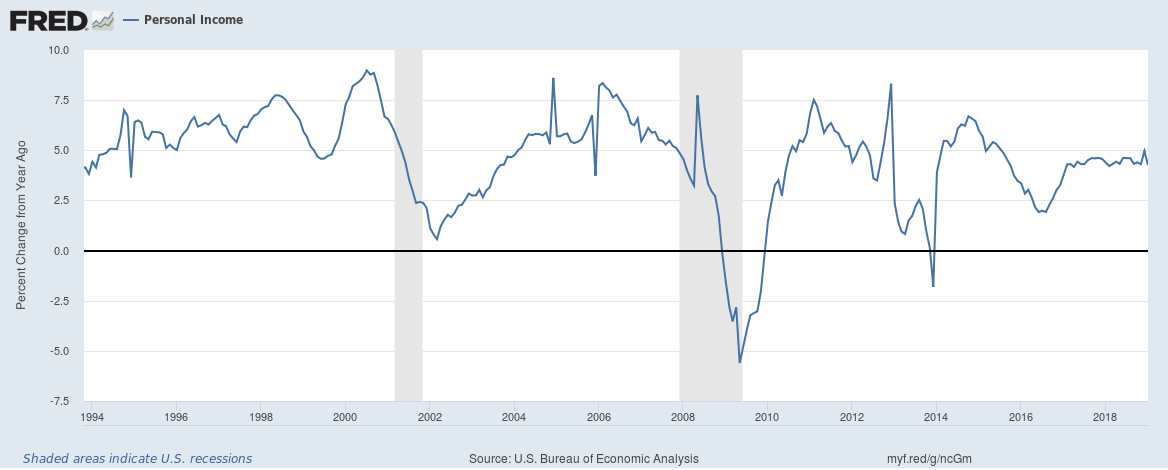 - Click to enlarge |
ProductionThe Philly Fed was a bit of an outlier as most of these sentiment based indicators were pretty solid. These indicators aren’t very useful in identifying tops; they are mostly coincident with economic activity. They do seem to be more useful at bottoms but we’re a long way from that. |
Production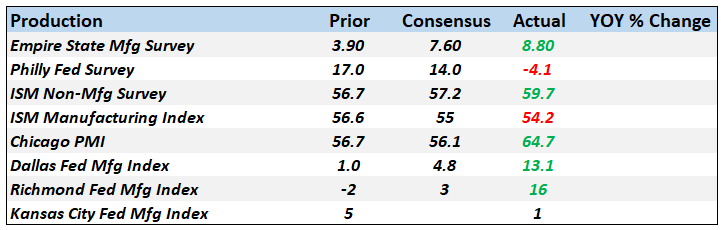 - Click to enlarge |
Consumption & DistributionA lot of people have been dismissing the December retail sales report as “obviously” wrong. I don’t think so as it is confirmed through multiple other reports. Wholesale sales were down in December as well and a build in inventory was a “positive” in Q4 GDP. The drop in activity in December was, I believe, driven by the stock market selloff. Most research on the wealth effect shows a small impact but all that research was done before the age of QE. Ben Bernanke may have changed the dynamic by telling everyone the intent of QE was to raise asset prices and thereby increase economic activity. So now, changes in the stock market have a bigger impact on the economy because everyone knows that everyone else knows that the stock market has an impact on economic activity. |
Consumption and Distribution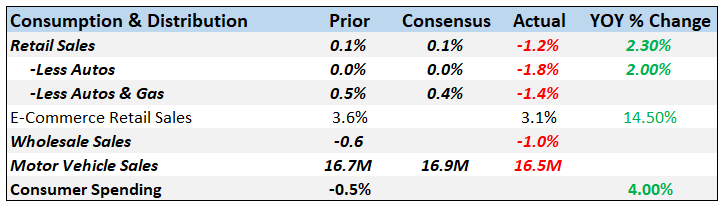 - Click to enlarge |
Inventories |
Inventories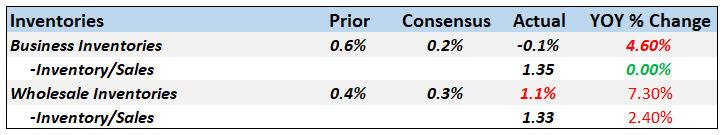 - Click to enlarge |
| Inventory to sales ratios are rising again as sales fall and inventories build. It was a positive for Q4 but probably a negative for Q1. |
U.S. Merchant Wholesalers and Inventories to Sales Ratio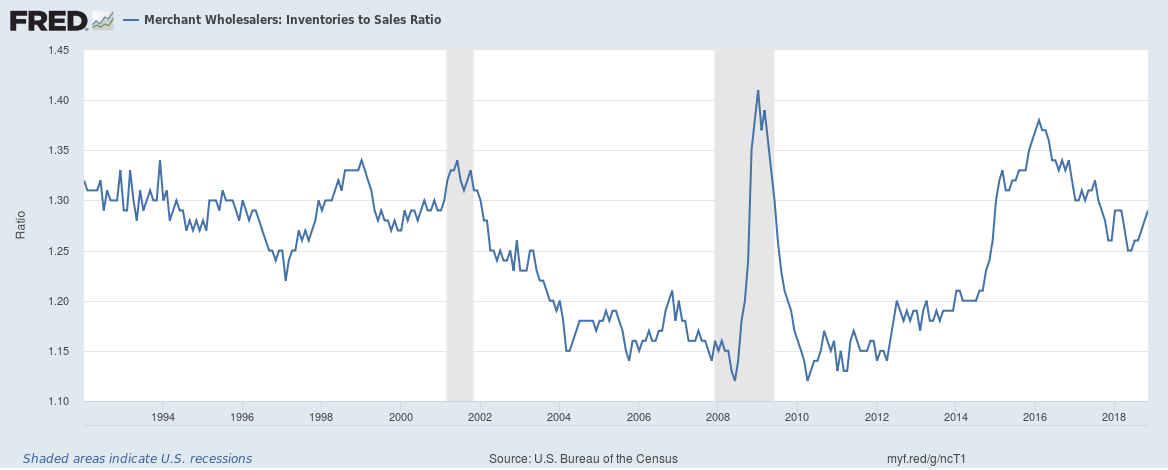 - Click to enlarge |
OrdersFactory orders for December were up but barely at 0.1% and well less than the expectation of a 0.6% gain. And that is the extent of the good news. Orders were down 2% in October and 0.5% in November so Q4 was pretty awful. Of more concern are core capital goods orders which were down 1% in November and 1.1% in December (that is the revised number in the Factory Orders report). Non-residential investment was reported up in the Q4 GDP report but that number is driven by shipments not orders. Expect Q1 to be weak on investment and with residential still having problems too it could be a very weak start to the new year. |
Orders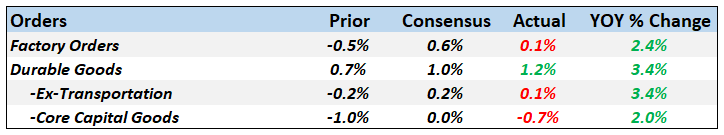 - Click to enlarge |
| Capital goods orders are turning lower from the same peak level as 2000, 2008 and 2014. I know I keep carping on this but given the growth of GDP, capital goods orders should be a lot higher today than they were at the turn of the century. The chart below shows core capital goods orders/Nominal GDP and it has been falling since 1997. Why aren’t companies investing? |
U.S. Manufacturers New Orders, 1994 - 2018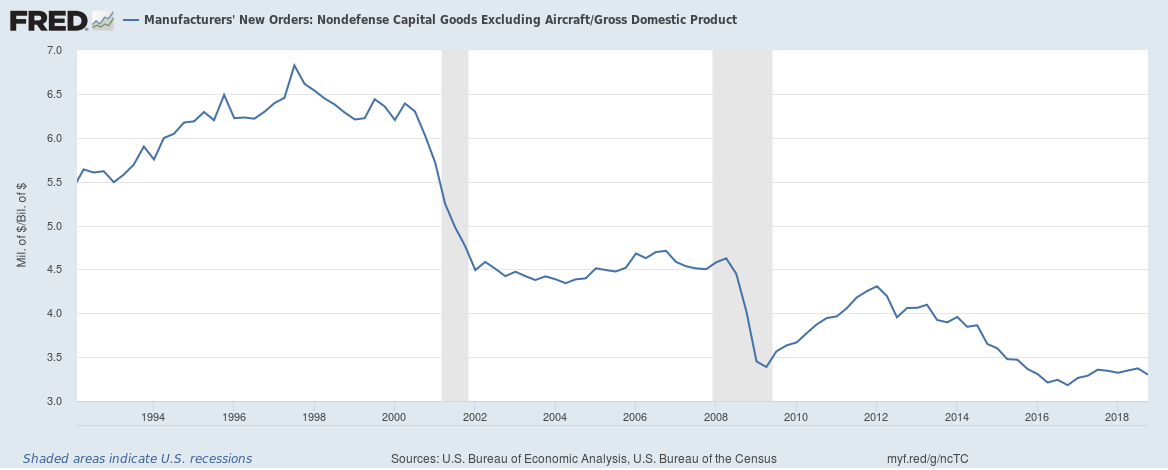 - Click to enlarge |
Trade |
Trade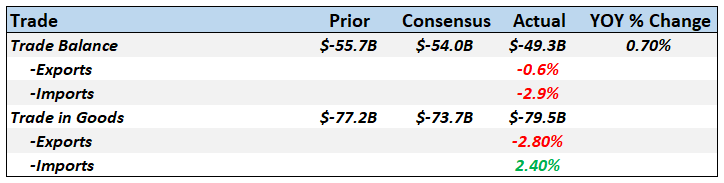 - Click to enlarge |
| President Trump promised he’d change the trade deficit and he has. Of course, he promised to shrink it and it has done nothing of the sort. In fact, it continues to expand. One is tempted to say it’s a good thing since imports tend to rise when our economy is good. But when you look at trade as a whole, including services, the picture is a bit more grim. Contracting exports and imports is not good in any way. And it is exactly what one would predict from the history of tariffs. Those who don’t know history and so forth. Fortunately the change so far is small and I hope we can get some kind of deal with China soon. Of course, Trump has already started bashing other countries so, as Yoda might say, continue the trade wars will. It is all very tiresome and pointless but it does have an impact on the markets so we’ll continue to monitor it. |
U.S. Trade Balance: Goods and Services and Balance of Payments Basis(see more posts on U.S. Trade Balance, )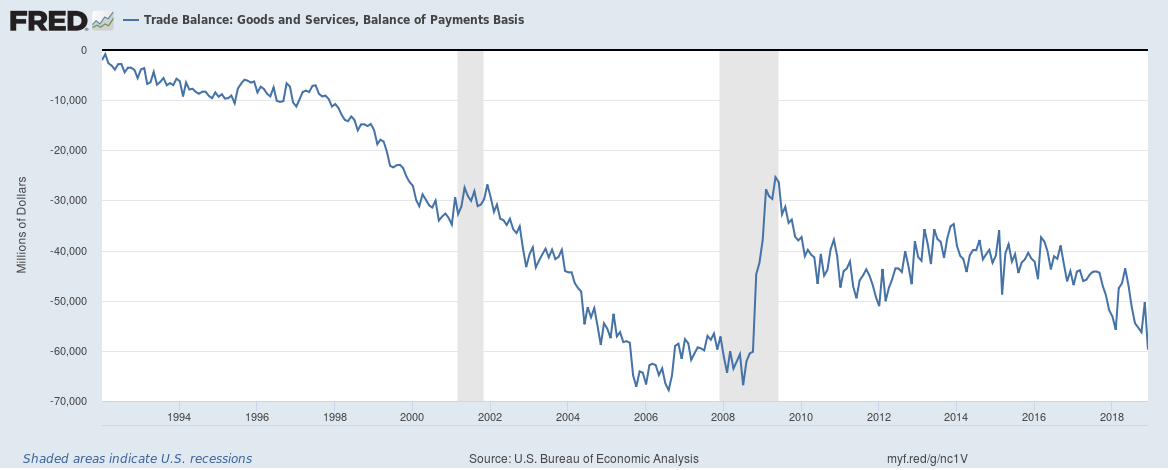 - Click to enlarge |
InflationInflation is just not a problem and won’t be as long as the dollar remains strong. |
Inflation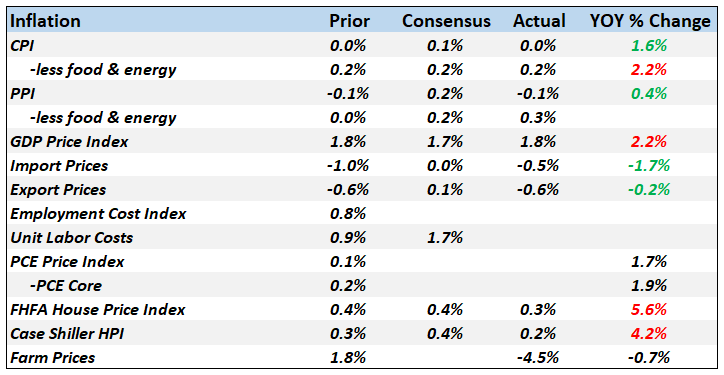 - Click to enlarge |
Employment |
Employment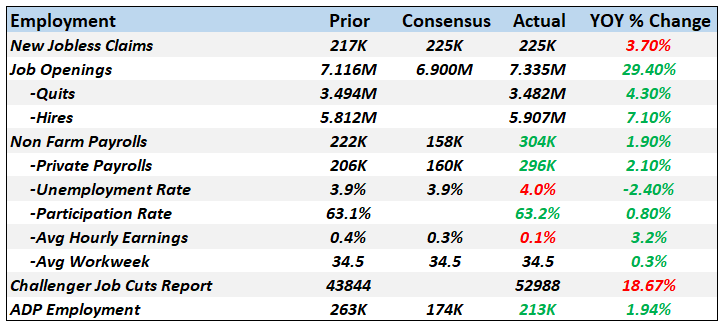 - Click to enlarge |
| There are lot of mixed signals in the employment data. Challenger Job cuts keep rising but job openings do too. The monthly average for new jobs in the official non farm payrolls report has been rising lately as well. On the other hand the unemployment rate has recently ticked slightly higher. That has been characterized as a good thing by some since it is primarily due to a rising participation rate. But a year over year rise in the unemployment rate in the past has been a pretty good indicator of recession and we’re getting close. Unemployment claims have also turned higher year over year, another negative sign. |
U.S. Civilian Unemployment Rate, 1980 - 2018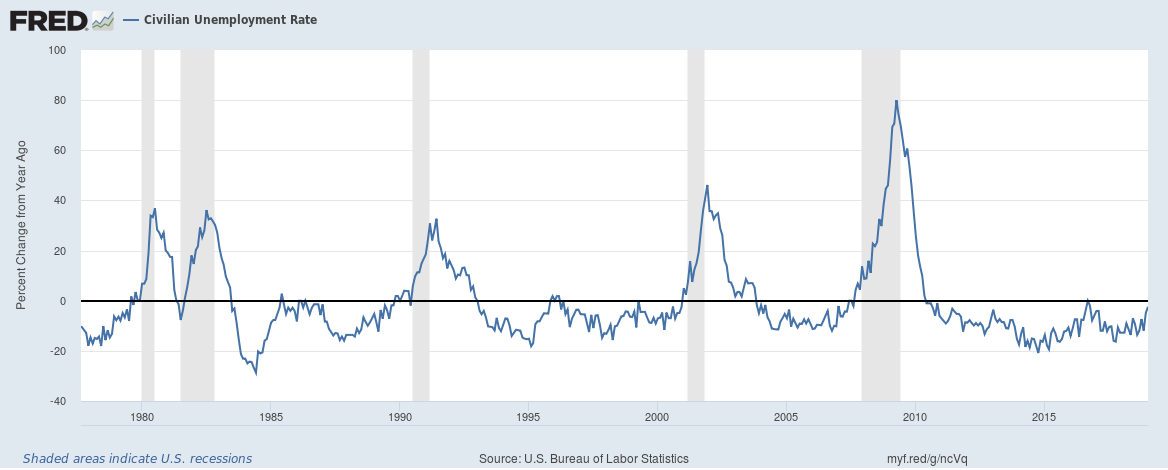 - Click to enlarge |
Construction |
Construction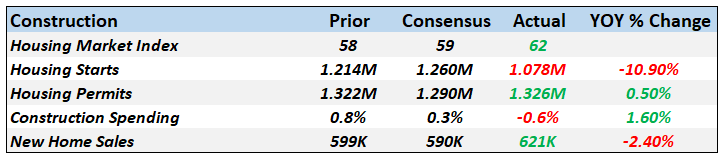 - Click to enlarge |
| Residential investment was a negative again in Q4 GDP. Housing has never really recovered to normal since the 2008 crisis and now it appears to be turning lower again. Not enough to say it is a decline that looks like recession but it isn’t a positive that’s for sure. Housing starts today are no higher than they were in 2014. That’s five years ago now and no progress in that amount of time is, if nothing else, just plain disappointing. I have no doubt that home building will continue to recover over the next decade but shorter term it ain’t looking good. |
U.S. Housing Starts: New Privately Owned Housing Units, 1960 - 2018(see more posts on U.S. Housing Starts, )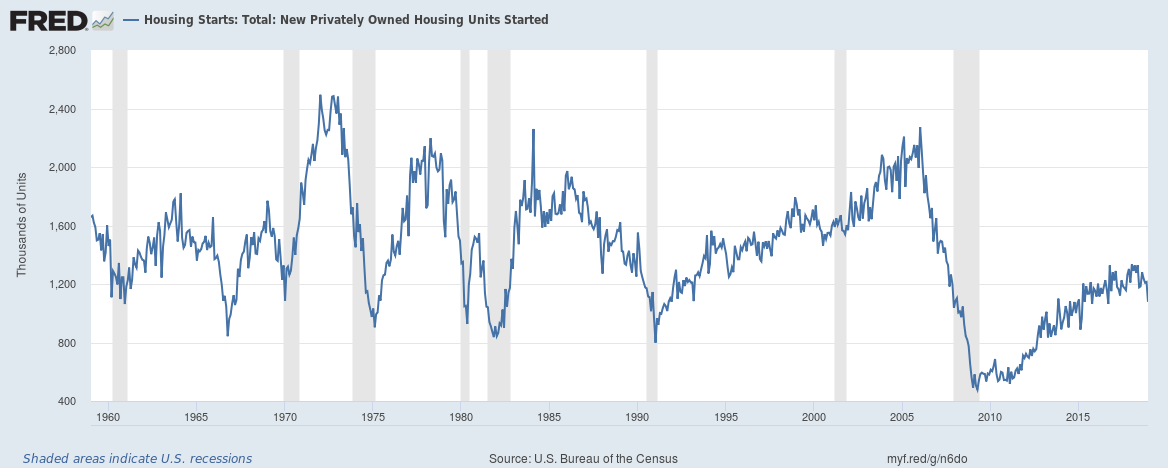 - Click to enlarge |
SentimentConsumer sentiment and confidence took a hit during the stock market selloff and during the government shutdown. Both are rebounding but are not back to their previous highs. Sentiment is a coincident indicator at best so it really doesn’t tell us much about the future anyway. |
Sentiment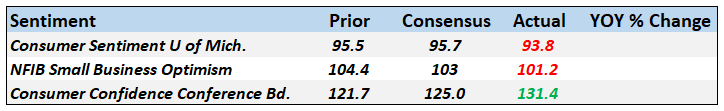 - Click to enlarge |
The economic slowdown may have peaked already but we really won’t know until we get caught up on the economic data. The consumer sentiment/confidence data seems to confirm that December was the nadir of the slowdown so far. Confidence has rebounded in the first two months of the year and I expect the economic data to show a similar trajectory. There are definitely problems with the economy but for now it doesn’t look recessionary.
I’ll review our market indicators next week.
Tags: Alhambra Research,capital goods orders,Construction,economy,factory orders,Featured,industrial production,inflation,inventory to sales ratio,manufacturing,Monthly Macro Monitor,newsletter,Personal Income,Retail sales,Savings Rate,sentiment,Trade