We do not like Purchasing Power or Real Effective Exchange Rate (REER) as measurement for currencies. For us, the trade balance decides if a currency is overvalued. Only the trade balance can express productivity gains, while the REER assumes constant productivity in comparison to trade partners. Who has read Michael Pettis, knows that a rising trade surplus may also be caused by a higher savings rate while the trade partners decided to spend more. This is partially true. Recently Europeans started to increase their savings rate, while Americans reduced it. This has led to a rising trade and current surplus for the Europeans. But also to a massive Swiss trade surplus with the United States, that lifted Switzerland on
Topics:
George Dorgan considers the following as important: 2) Swiss and European Macro, Featured, newsletter, Switzerland Exports, Switzerland Exports by Sector, Switzerland Imports, Switzerland Imports by Sector, Switzerland Trade Balance
This could be interesting, too:
Nachrichten Ticker - www.finanzen.ch writes Die Performance der Kryptowährungen in KW 9: Das hat sich bei Bitcoin, Ether & Co. getan
Nachrichten Ticker - www.finanzen.ch writes Wer verbirgt sich hinter der Ethereum-Technologie?
Martin Hartmann writes Eine Analyse nach den Lehren von Milton Friedman
Marc Chandler writes March 2025 Monthly
We do not like Purchasing Power or Real Effective Exchange Rate (REER) as measurement for currencies. For us, the trade balance decides if a currency is overvalued. Only the trade balance can express productivity gains, while the REER assumes constant productivity in comparison to trade partners.
Who has read Michael Pettis, knows that a rising trade surplus may also be caused by a higher savings rate while the trade partners decided to spend more. This is partially true.
Recently Europeans started to increase their savings rate, while Americans reduced it. This has led to a rising trade and current surplus for the Europeans.
But also to a massive Swiss trade surplus with the United States, that lifted Switzerland on the U.S. currency manipulation watch list.
To control the trade balance against this “savings effect”, economists may look at imports. When imports are rising at the same pace as GDP or consumption, then there is no such “savings effect”.
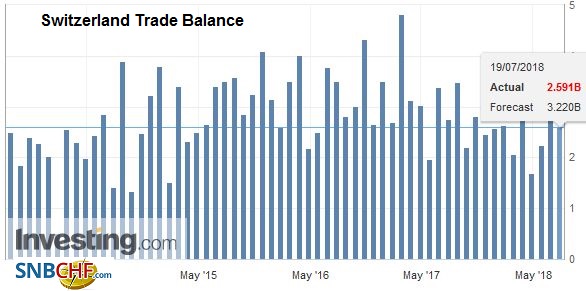
After the record trade surpluses, the Swiss economy may have turned around: consumption and imports are finally rising more.
Swiss National Bank wants to keep non-profitable sectors alive
Swiss exports are moving more and more toward higher value sectors: away from watches, jewelry and manufacturing towards chemicals and pharmaceuticals. With currency interventions, the SNB is trying to keep sectors alive, that would not survive without interventions.
At the same time, importers keep the currency gains of imported goods and return little to the consumer. This tendency is accentuated by the SNB, that makes the franc weaker.
Texts and Charts from the Swiss customs data release (translated from French).
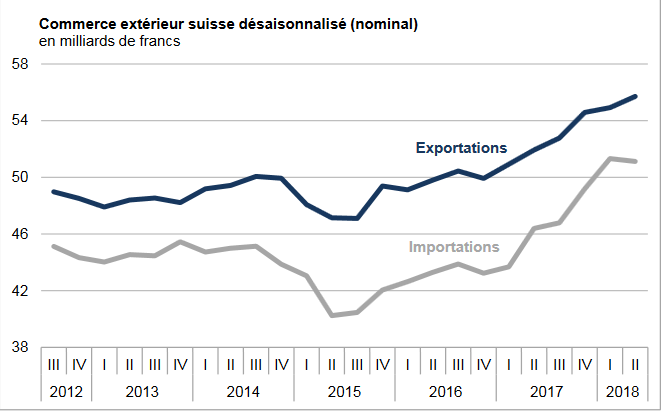
Exports and Imports YoY DevelopmentThe dynamism shown by exports since the beginning of 2017 continued in the second quarter of 2018. They are thus flying from record to record for the fifth quarter in a row. Imports, on the other hand, came to a standstill, at a high level, however, after posting strong growth in previous quarters. The trade balance closes on a surplus of 4.6 billion francs.
In short |
Swiss exports and imports, seasonally adjusted (in bn CHF), June 2018(see more posts on Switzerland Exports, Switzerland Imports, ) Source: newsd.admin.ch - Click to enlarge |
Overall evolutionIn the second quarter of 2018, exports continued their momentum with a rise of 1.4% in seasonally adjusted terms (real: +1.8%). At 55.7 billion francs, they achieved their fifth consecutive quarterly record. After posting steady growth since early 2017, imports stagnated at a very high level (-0.4%, real: + 0.5%). The surplus of the commercial balance is established at 4584 million francs. |
Switzerland Trade Balance, Jun 2018(see more posts on Switzerland Trade Balance, ) Source: investing.com - Click to enlarge |
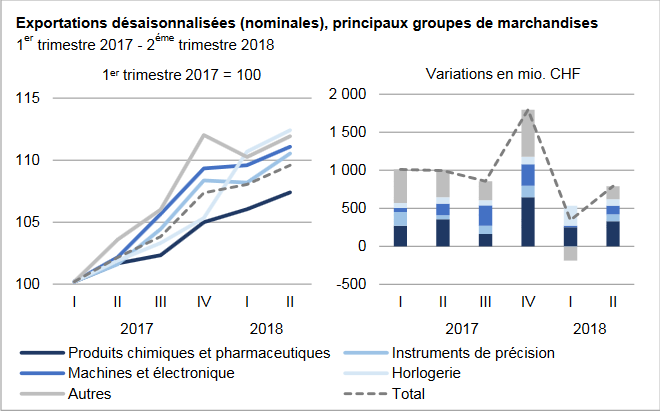
ExportsExports: double-digit growth for watches, precision instruments and one-year machines From +1.3 (chemicals and pharmaceuticals) to + 2.2% (precision instruments) in Q2 2018, all major groups have surfed on their positive export trend. The chemistry-pharma largely influenced the result, representing 42% of the overall growth.
The machinery and electronics sector confirmed its good shape with an increase of CHF 116 million (+ 1.4%, real: + 2.3%), just like watchmaking
and precision instruments. Among other commodities, jewellery (+ 11.4%), vehicles and food, beverages and tobacco led the way.From a geographical point of view, exports strengthened in the three main markets. The Asia occupied the top of the table (+ 1.8% or +222 million francs) and confirmed its upward trend over one year. North America (USA: + 4.5% and record level) and Europe gained 1.1% and 1.0% respectively. In the latter, Germany (record), France (+598 million francs, jewellery) and the Netherlands came to the fore. As in the previous quarter, the United Kingdom plunged (-10.9%) to its lowest level in five years. On the Asian continent, evolution took root in the United Arab Emirates (+211 million francs) and in Hong Kong. If volatility characterizes the former, the latter draw a positive trend. For their part, exits to China reached a record level. |
Swiss Exports per Sector, Q1 2017 vs. Q2 2018(see more posts on Switzerland Export, Switzerland Exports by Sector, ) Source: newsd.admin.ch - Click to enlarge |
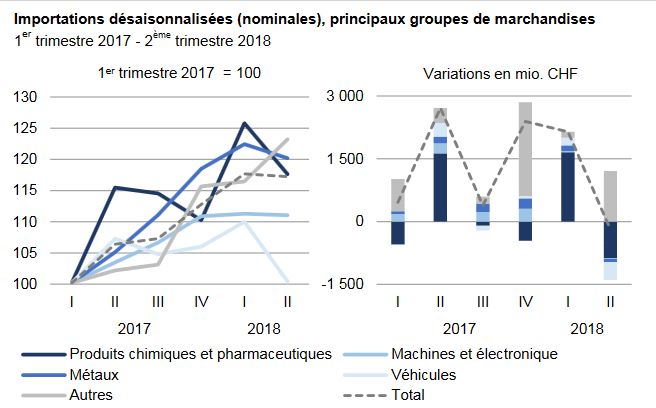
ImportsExcluding jewellery, all major commodity groups declined in the second quarter of 2018. After a dynamic previous quarter, the flagship chemical and pharmaceutical sector lost 6.5% (-871 million francs). leaded by the fall of one-fifth of the active ingredients. Nevertheless, the sector remains on the rise over a five-quarter horizon. The sharp contraction of vehicles is explained by the fall of the aeronautical segment (-51%, -486 million francs). In other commodities, the trend has been on the rise since the beginning of 2017, driven by jewellery. In the second quarter of 2018, this sector jumped by two fifths and 1.3 billion francs respectively (before any returns of goods and gold for overhaul). The evolution of imports has been particularly divergent between the first three sources of supply. While North America declined by a tenth (USA: -326 million francs, airliners), Europe and Asia registered a slight increase respectively leap 8.4%. On the European continent, the third consecutive increase in Germany (+319 million francs) contrasted with the decline in Ireland (-663 million), the United Kingdom (-195 million) and the United Kingdom. ‘Italy. The European trend is still clearly upward since the beginning of 2017. Over the same period, the Asian continent has risen by almost 40%, driven by the United Arab Emirates. Imports from this country even quadrupled in one year to reach 1.6 billion francs (jewellery). The entries of Chinese origin gained 122 million francs. Conversely, Japan fell by 110 million francs, confirming its negative spiral. |
Swiss Imports per Sector, Q1 2017 vs. Q2 2018(see more posts on Switzerland Imports, Switzerland Imports by Sector, ) |
Tags: Featured,newsletter,Switzerland Exports,Switzerland Exports by Sector,Switzerland Imports,Switzerland Imports by Sector,Switzerland Trade Balance

