United States The 201k rise in US non-farm payrolls edged above the median forecasts, but the 50k downward revision to the past two-months removes the gloss. It is the first August report in seven years that the initial estimate was above the Bloomberg median. U.S. Nonfarm Payrolls, Sep 2013 - Sep 2018(see more posts on U.S. Nonfarm Payrolls, ) Source: investing.com - Click to enlarge The most important part of the report was the 0.4% jump in hourly earnings, lifting the year-over-year rate to a new cyclical high of 2.9%. It will be seen as evidence that the labor market is tightening. While there was no doubt that the Fed will hike rates later this month, today’s data is unlikely to get many investors to change
Topics:
Marc Chandler considers the following as important: 4) FX Trends, CAD, EUR, Featured, GBP, jobs, JPY, newsletter, SEK, TLT, USD
This could be interesting, too:
Nachrichten Ticker - www.finanzen.ch writes Die Performance der Kryptowährungen in KW 9: Das hat sich bei Bitcoin, Ether & Co. getan
Nachrichten Ticker - www.finanzen.ch writes Wer verbirgt sich hinter der Ethereum-Technologie?
Martin Hartmann writes Eine Analyse nach den Lehren von Milton Friedman
Marc Chandler writes March 2025 Monthly
United StatesThe 201k rise in US non-farm payrolls edged above the median forecasts, but the 50k downward revision to the past two-months removes the gloss. It is the first August report in seven years that the initial estimate was above the Bloomberg median. |
U.S. Nonfarm Payrolls, Sep 2013 - Sep 2018(see more posts on U.S. Nonfarm Payrolls, )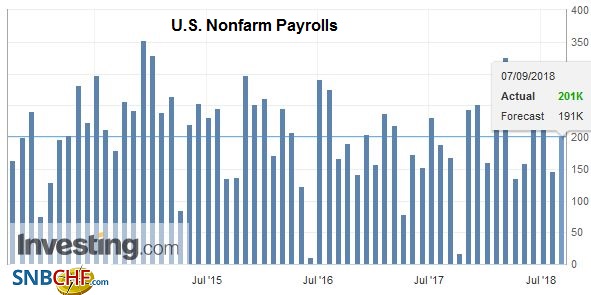 Source: investing.com - Click to enlarge |
| The most important part of the report was the 0.4% jump in hourly earnings, lifting the year-over-year rate to a new cyclical high of 2.9%. It will be seen as evidence that the labor market is tightening. While there was no doubt that the Fed will hike rates later this month, today’s data is unlikely to get many investors to change their outlook for the December meeting. |
U.S. Average Weekly Hours, Oct 2013 - Sep 2018(see more posts on U.S. Average Weekly Hours, )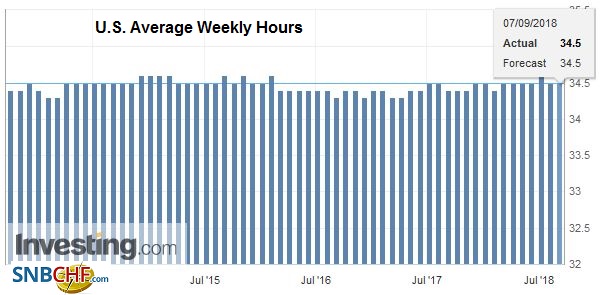 Source: investing.com - Click to enlarge |
| It is disappointing that the participation rate fell to 62.7%, matching the lows since mid-2016. The 0.2% decline, however, helped prevent a decline in the unemployment rate. It was steady at 3.9%, but the under-employment rate eased to a new cyclical low of 7.4%. This also reinforces the sense that full employment is near. |
U.S. Participation Rate, Sep 2014 - Sep 2018(see more posts on U.S. Participation Rate, )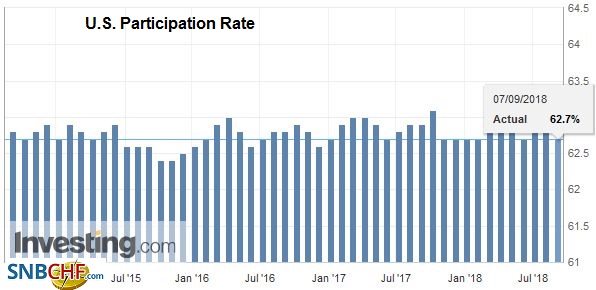 Source: investing.com - Click to enlarge |
CanadaCanada also reported August jobs data. It was a mixed report. The headline loss of 51.6k jobs is deceiving. Canada actually added 40k full-time positions after losing 28k in July. The country lost 92k part-time positions after gaining 82k in July. |
Canada Employment Change, Sep 2013 - Sep 2018(see more posts on Canada Employment Change, )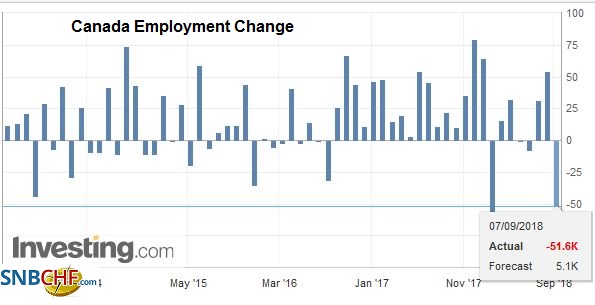 Source: investing.com - Click to enlarge |
| However, it is less constructive that the participation rate slipped (to 65.3% from 65.4%) and helping lift the unemployment rate (6.0% from 5.85). |
Canada Participation Rate, Oct 2013 - Sep 2018(see more posts on Canada Participation Rate, )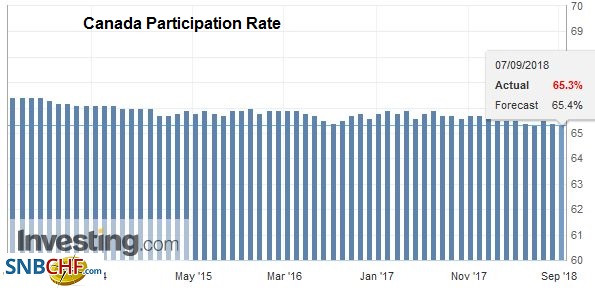 Source: investing.com - Click to enlarge |
| Also, hourly earnings growth for permanent workers slowed to 2.6% (from 3.0%), which is the slowest since last October. The data is unlikely to turn market opinion away from expecting a hike next month. |
Canada Unemployment Rate, Oct 2013 - Sep 2018(see more posts on Canada Unemployment Rate, )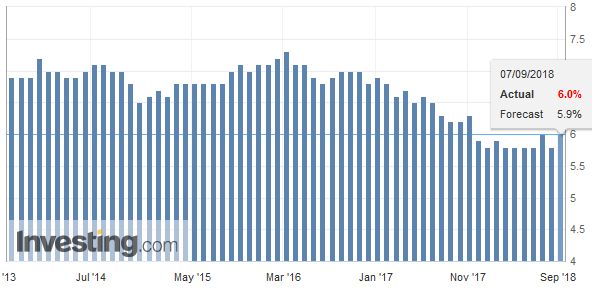 Source: investing.com - Click to enlarge |
Tags: #GBP,#USD,$CAD,$EUR,$JPY,$TLT,Featured,jobs,newsletter,SEK
