The economic reports released since the last update were slightly more upbeat than the previous period. The economic surprises have largely been on the positive side but there were some major disappointments as well. The economy has been doing this for several years now, one part of the economy waxing while another wanes and the overall trajectory not much changed. Indeed, the broad Chicago Fed National Activity index probably says it all, coming in at -0.01. That number represents current growth versus the longer term trend with positive being better than trend growth and negative being worse than trend growth. -0.01 is about as close to on trend as you’re going to get. And that trend is the now very familiar,
Topics:
Joseph Y. Calhoun considers the following as important: Alhambra Research, Bi-Weekly Economic Review, bonds, cfnai, commodities, copper to gold ratio, credit spreads, currencies, durable goods orders, economic growth, economy, existing home sales, Featured, Federal Reserve/Monetary Policy, Gold, industrial production, Interest rates, Investing, Markets, New Home Sales, newslettersent, Politics, Retail sales, Taxes/Fiscal Policy, The United States, TIPS, US dollar, Yield Curve
This could be interesting, too:
Investec writes The Swiss houses that must be demolished
Claudio Grass writes The Case Against Fordism
Nachrichten Ticker - www.finanzen.ch writes Die Performance der Kryptowährungen in KW 9: Das hat sich bei Bitcoin, Ether & Co. getan
Nachrichten Ticker - www.finanzen.ch writes Wer verbirgt sich hinter der Ethereum-Technologie?
The economic reports released since the last update were slightly more upbeat than the previous period. The economic surprises have largely been on the positive side but there were some major disappointments as well. The economy has been doing this for several years now, one part of the economy waxing while another wanes and the overall trajectory not much changed. Indeed, the broad Chicago Fed National Activity index probably says it all, coming in at -0.01. That number represents current growth versus the longer term trend with positive being better than trend growth and negative being worse than trend growth. -0.01 is about as close to on trend as you’re going to get. And that trend is the now very familiar, frustratingly new normal, secular stagnating rate of about 2%.
As I said though, there were some better than expected reports and we should note them. Who knows; it could be the start of a trend. Durable Goods orders, once you get past the headline -6.8% which was driven by Boeing orders, were up nicely year over year and the market took them as pretty positive. Even core capital goods orders were up 3.5% year over year. But don’t get too excited. As Jeff points out, the level of orders and shipments is still well below the peak of 10 years ago. Lost decade anyone? So, yes things have improved in the short term but we’re a long way from healthy.
Further complicating the durable goods report was an Industrial Production report that was at least a little contradictory. IP was less than expected and the manufacturing part was outright negative. The auto industry was the culprit with motor vehicle assemblies down a rather scary 14.5% from last year, the worst since 2009. Sales are already well off their highs and inventories are too high so ramping up production right now seems unlikely. Yes, these numbers are volatile and often see substantial revisions but the trend in autos was down before this release.
The regional Fed surveys released since my last update were all positive with special strength in new orders. One should remember though that these are “soft” data reports, sentiment based really, and often do not translate into actual activity. These reports were all higher back right after the election and early this year and the hard data never reflected the optimism.
Retail sales were also better than expected and running about 4% above the same time last year. That sounds good on the surface and it is certainly better than a smaller number but we’ve been stuck at that growth rate since 2012 where previous expansions routinely saw growth rates of 6% and above. Not only that but inventories are once again creeping higher at a pace faster than sales. Inventory/Sales ratios have ticked just a tad higher. I find it hard to believe that inventories are being built up voluntarily.
The most disappointing reports of the last two weeks though had to be the ones relating to housing. New home sales dropped nearly 10% month to month and are down nearly 9% year over year. Curiously, the Housing Market Index, which measures homebuilder sentiment, was better than expected at 68 (anything over 50 supposedly indicates expansion). Even curiouser, that report had a reading of 74 for present sales and just 49 for traffic. Seems like a disconnect there between sentiment and reality. Existing home sales were also down 1.3% month to month but managed a 2.1% rise year over year. Not terrible but not exactly healthy either. One thing weighing on housing is that new household formation appears to be rolling over again. Can’t get those kids out of the basement…
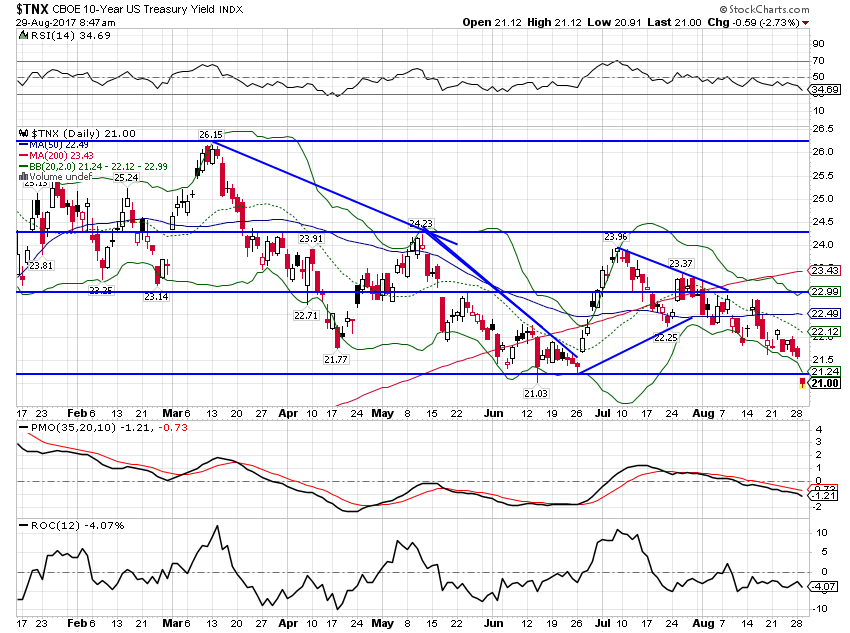
| Regardless of what the reports had to say, our market indicators didn’t change all that much. What movement we did see actually points to more economic weakness regardless of the surprise factor. The 10 year Treasury yield fell from the 2.19% level at the last update to today’s 2.10%. Some of the recent drop was driven by the North Korean situation but that is only this week. |
US 10 Year Treasury Yield Index, Feb - Aug 2017(see more posts on U.S. Treasuries, ) |
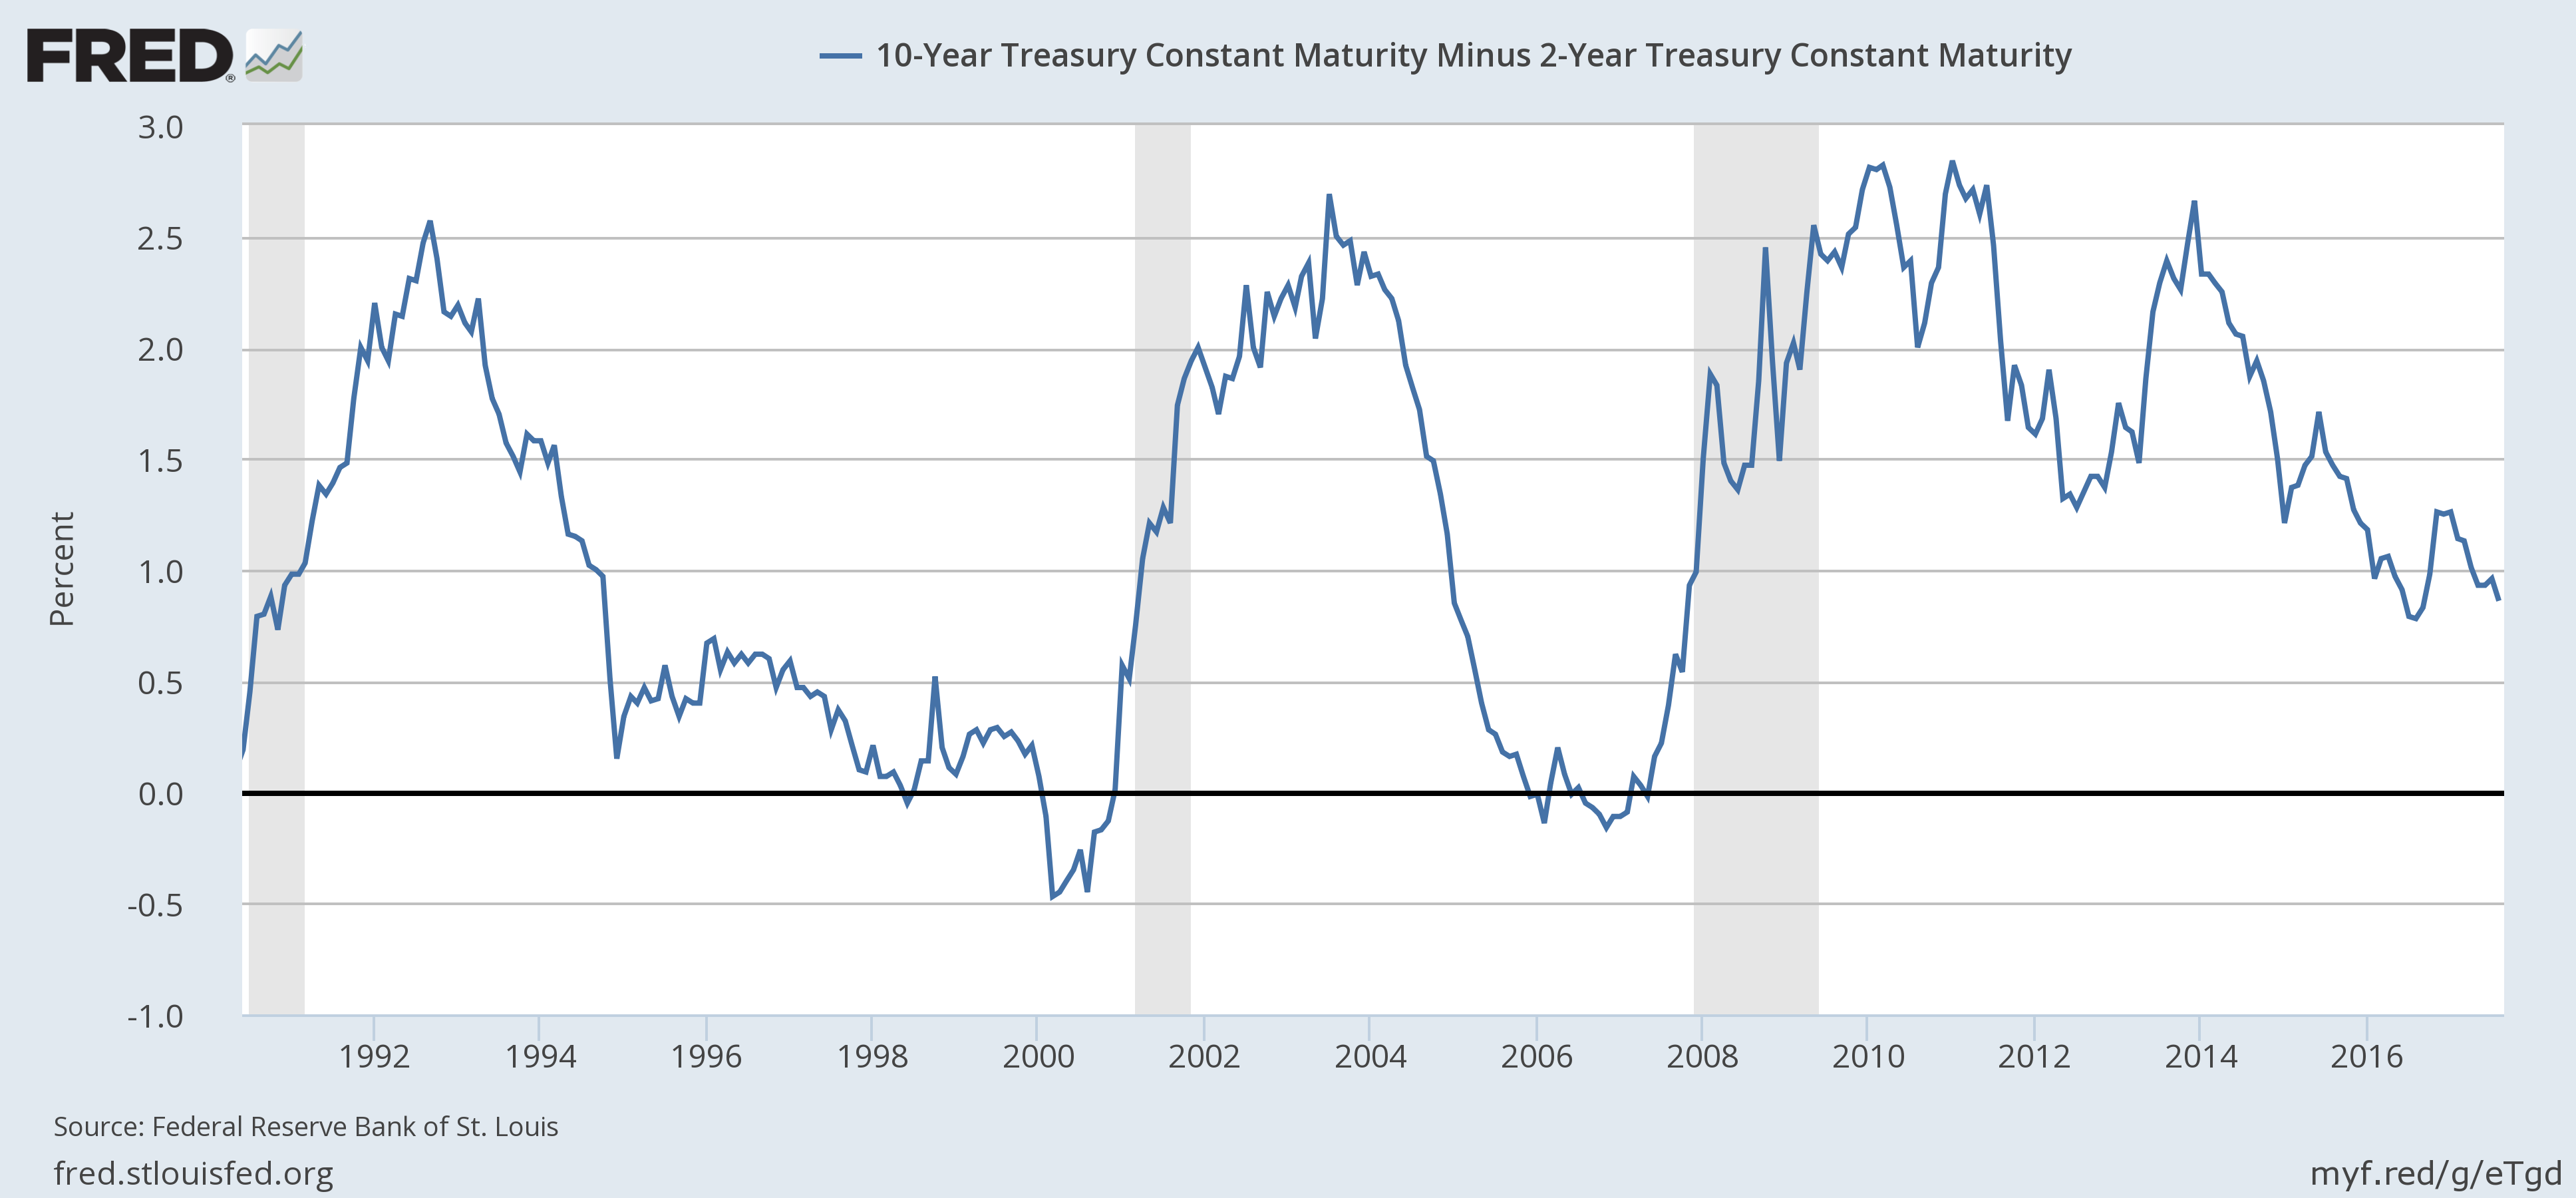
| The yield curve continued to flatten but only by 3 basis points. If past is prologue we still aren’t near recession. The curve isn’t flat and it isn’t acting like it normally does just prior to recession. We would expect a rapid steepening right before the onset of recession as short rates start to anticipate Fed action. Whether that holds true this cycle is hard to say but I expect it will, maybe just less dramatically. |
10 Year Treasury Constant Maturity Minus 2 Year Treasury Constant Maturity, 1992 - 2016(see more posts on U.S. Treasuries, ) |
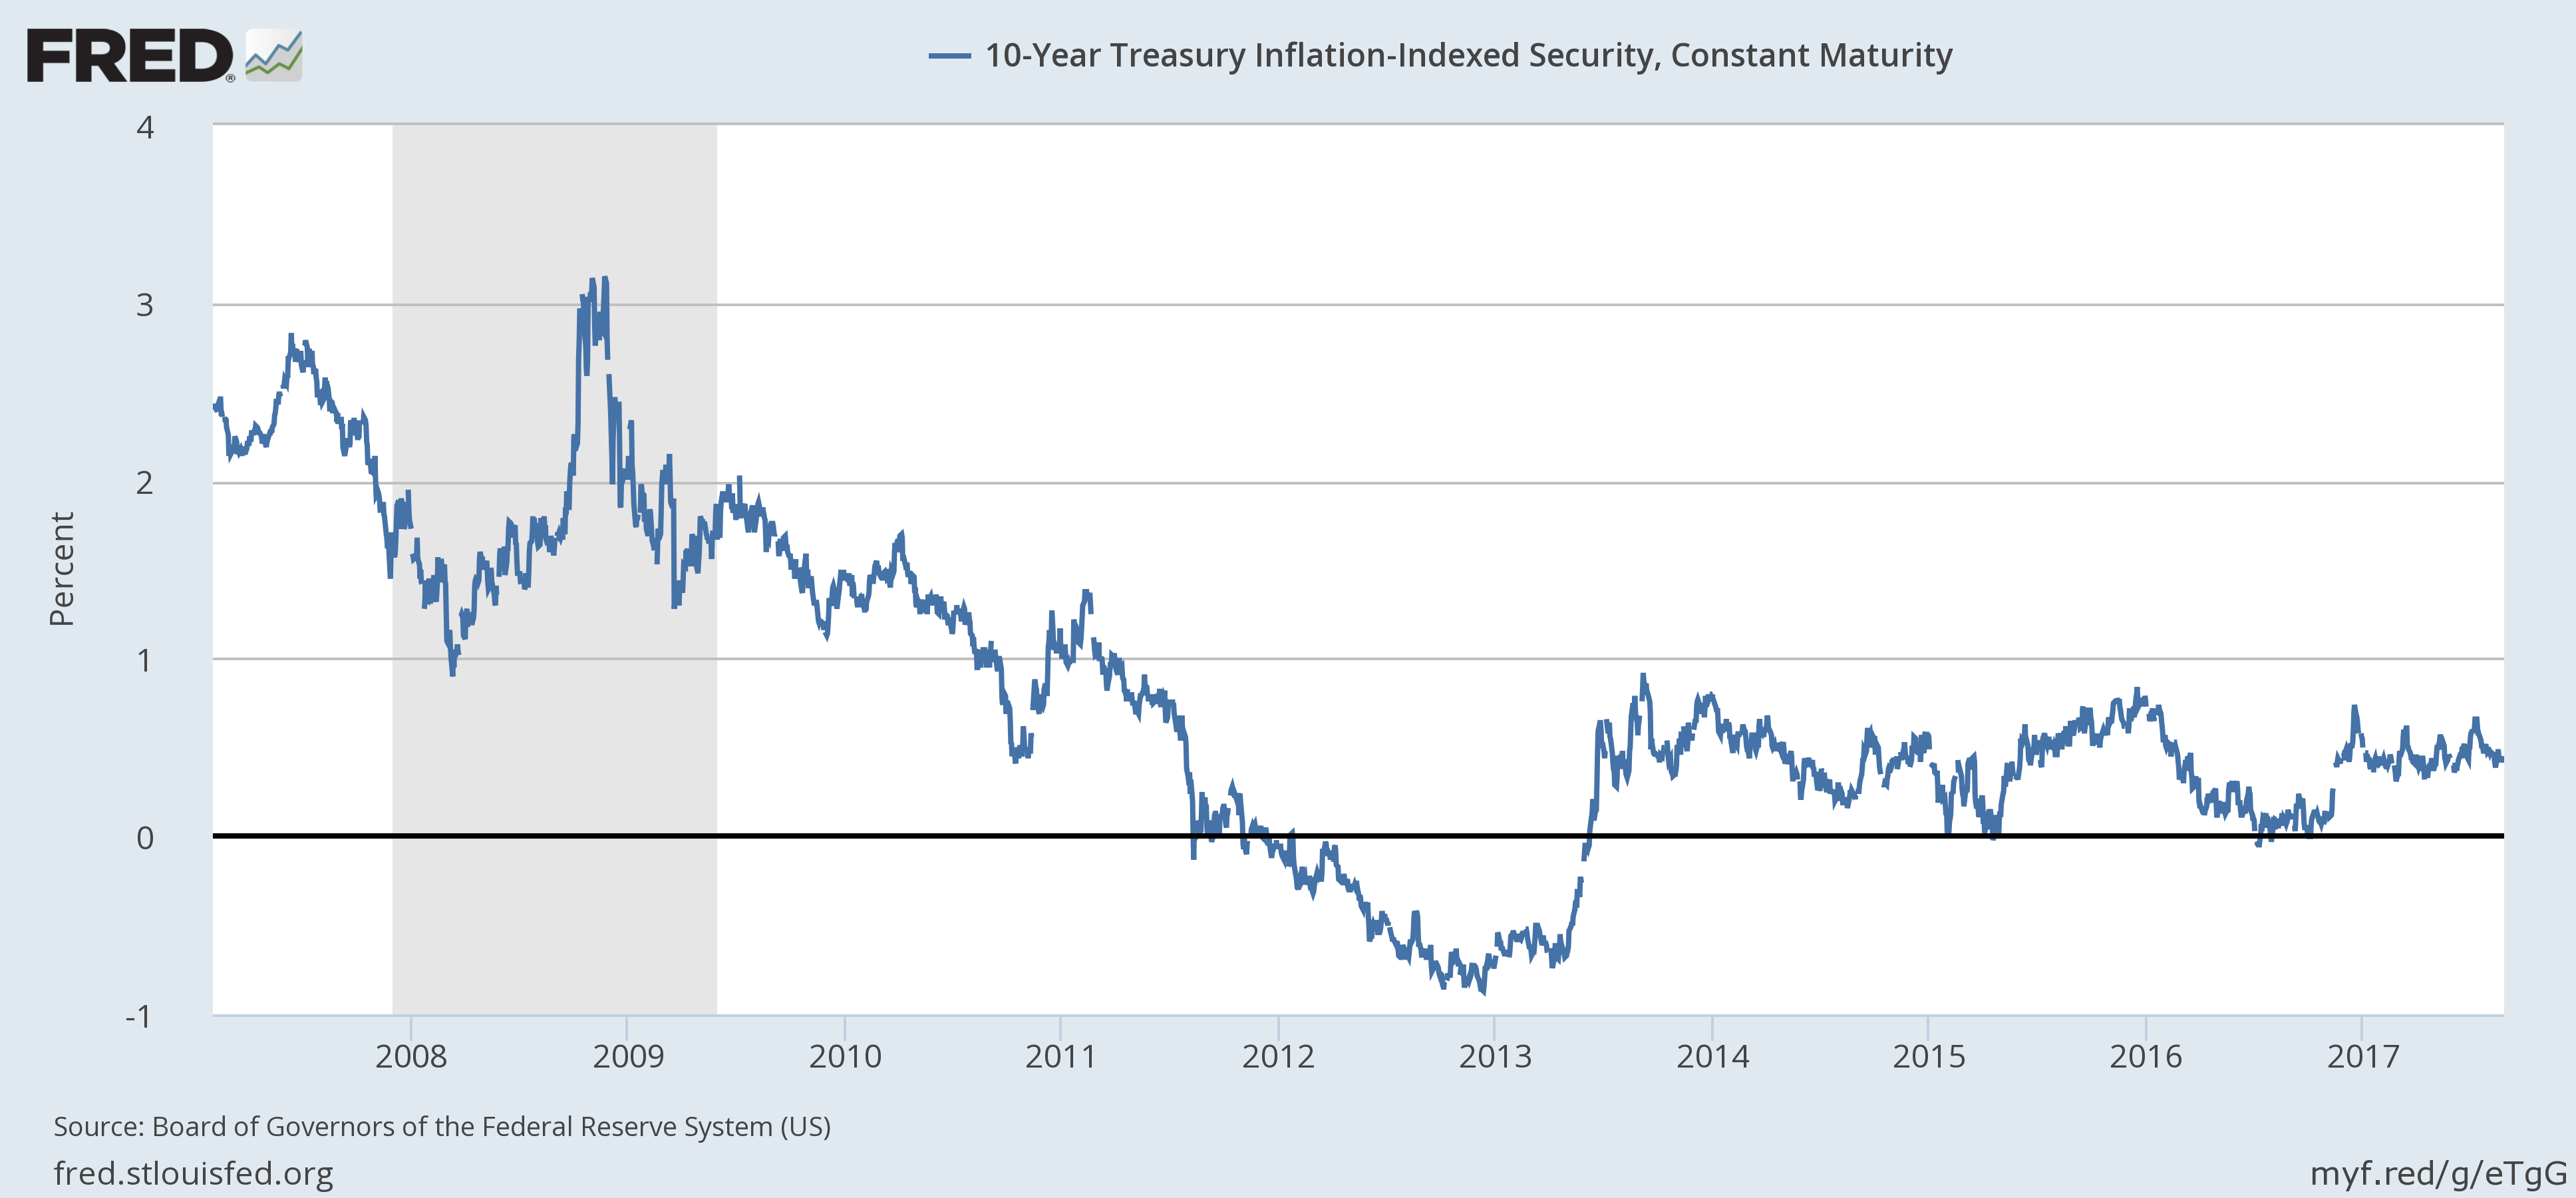
| 10 Year TIPS yields were actually up a couple of basis points, still pointing to slow growth: |
10 Year Treasury Inflation - Indexed Security, Constant Maturity, 2008 - 2017(see more posts on U.S. Treasuries, ) |
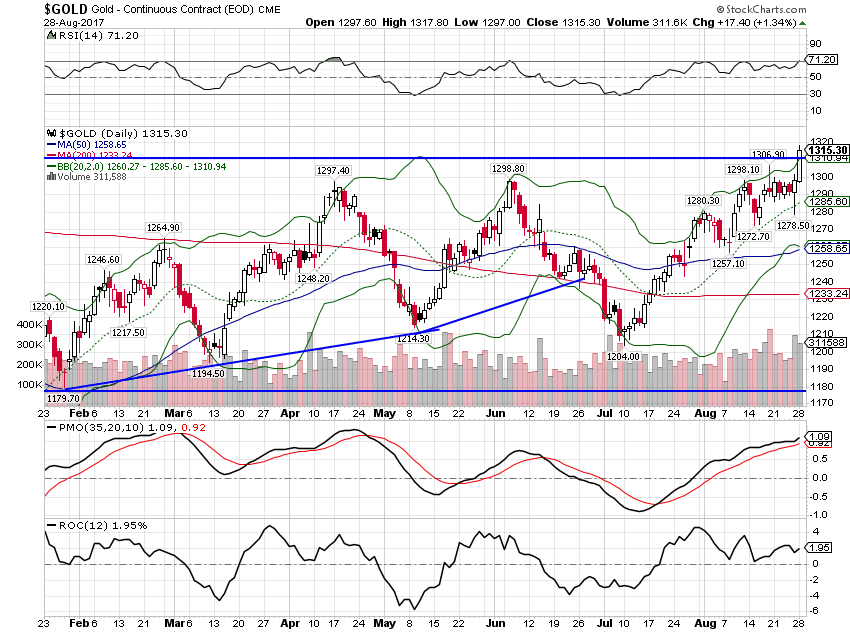
| Gold also points to economic weakness but part of the recent move is about geopolitics. Gold did, however, break out of its recent range prior to the North Korean missile Japan flyover. How much is economic and how much is fear of the NoKo nut? I don’t know but it may not matter. Capital parked in gold isn’t helping productivity that’s for sure. |
Gold Daily, Feb - Aug 2017(see more posts on Gold, ) |
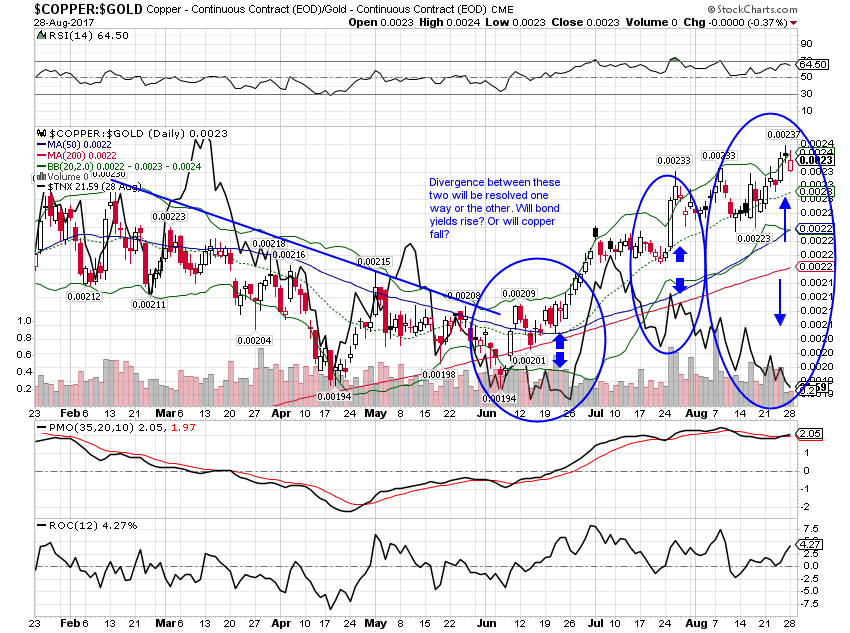
| The copper:gold ratio has diverged further from interest rates. The ratio did drop a bit yesterday (8-28-17) and probably will today as well but bonds rallied too. It is somewhat interesting that the ratio may drop more due to gold rising than copper falling. |
Copper:Gold Daily, Feb - Aug 2017(see more posts on Copper, Gold, ) |
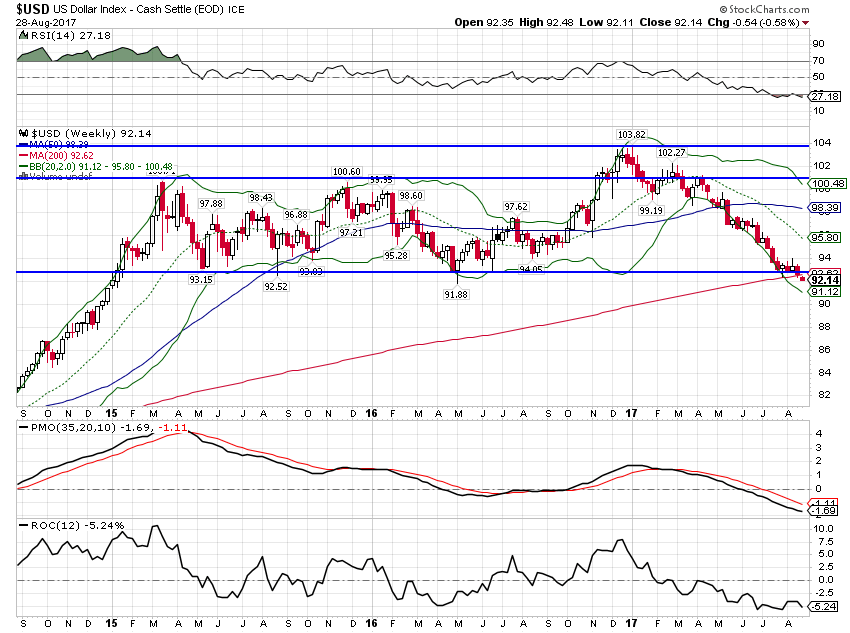
| Gold’s move is to some degree a function of what is going on with the dollar. The DXY is breaking support and technically one would expect further weakness. Sentiment is, however, very negative on the dollar and any positive news would probably produce a snapback. I also wonder how long before Draghi says something to bring the Euro back down. He can’t be happy about a Euro over 1.20. But I think the dollar trend is firmly in place now so any rally would be suspect. |
US Dollar Index, Sep 2015 - Aug 2017(see more posts on U.S. Dollar Index, ) |
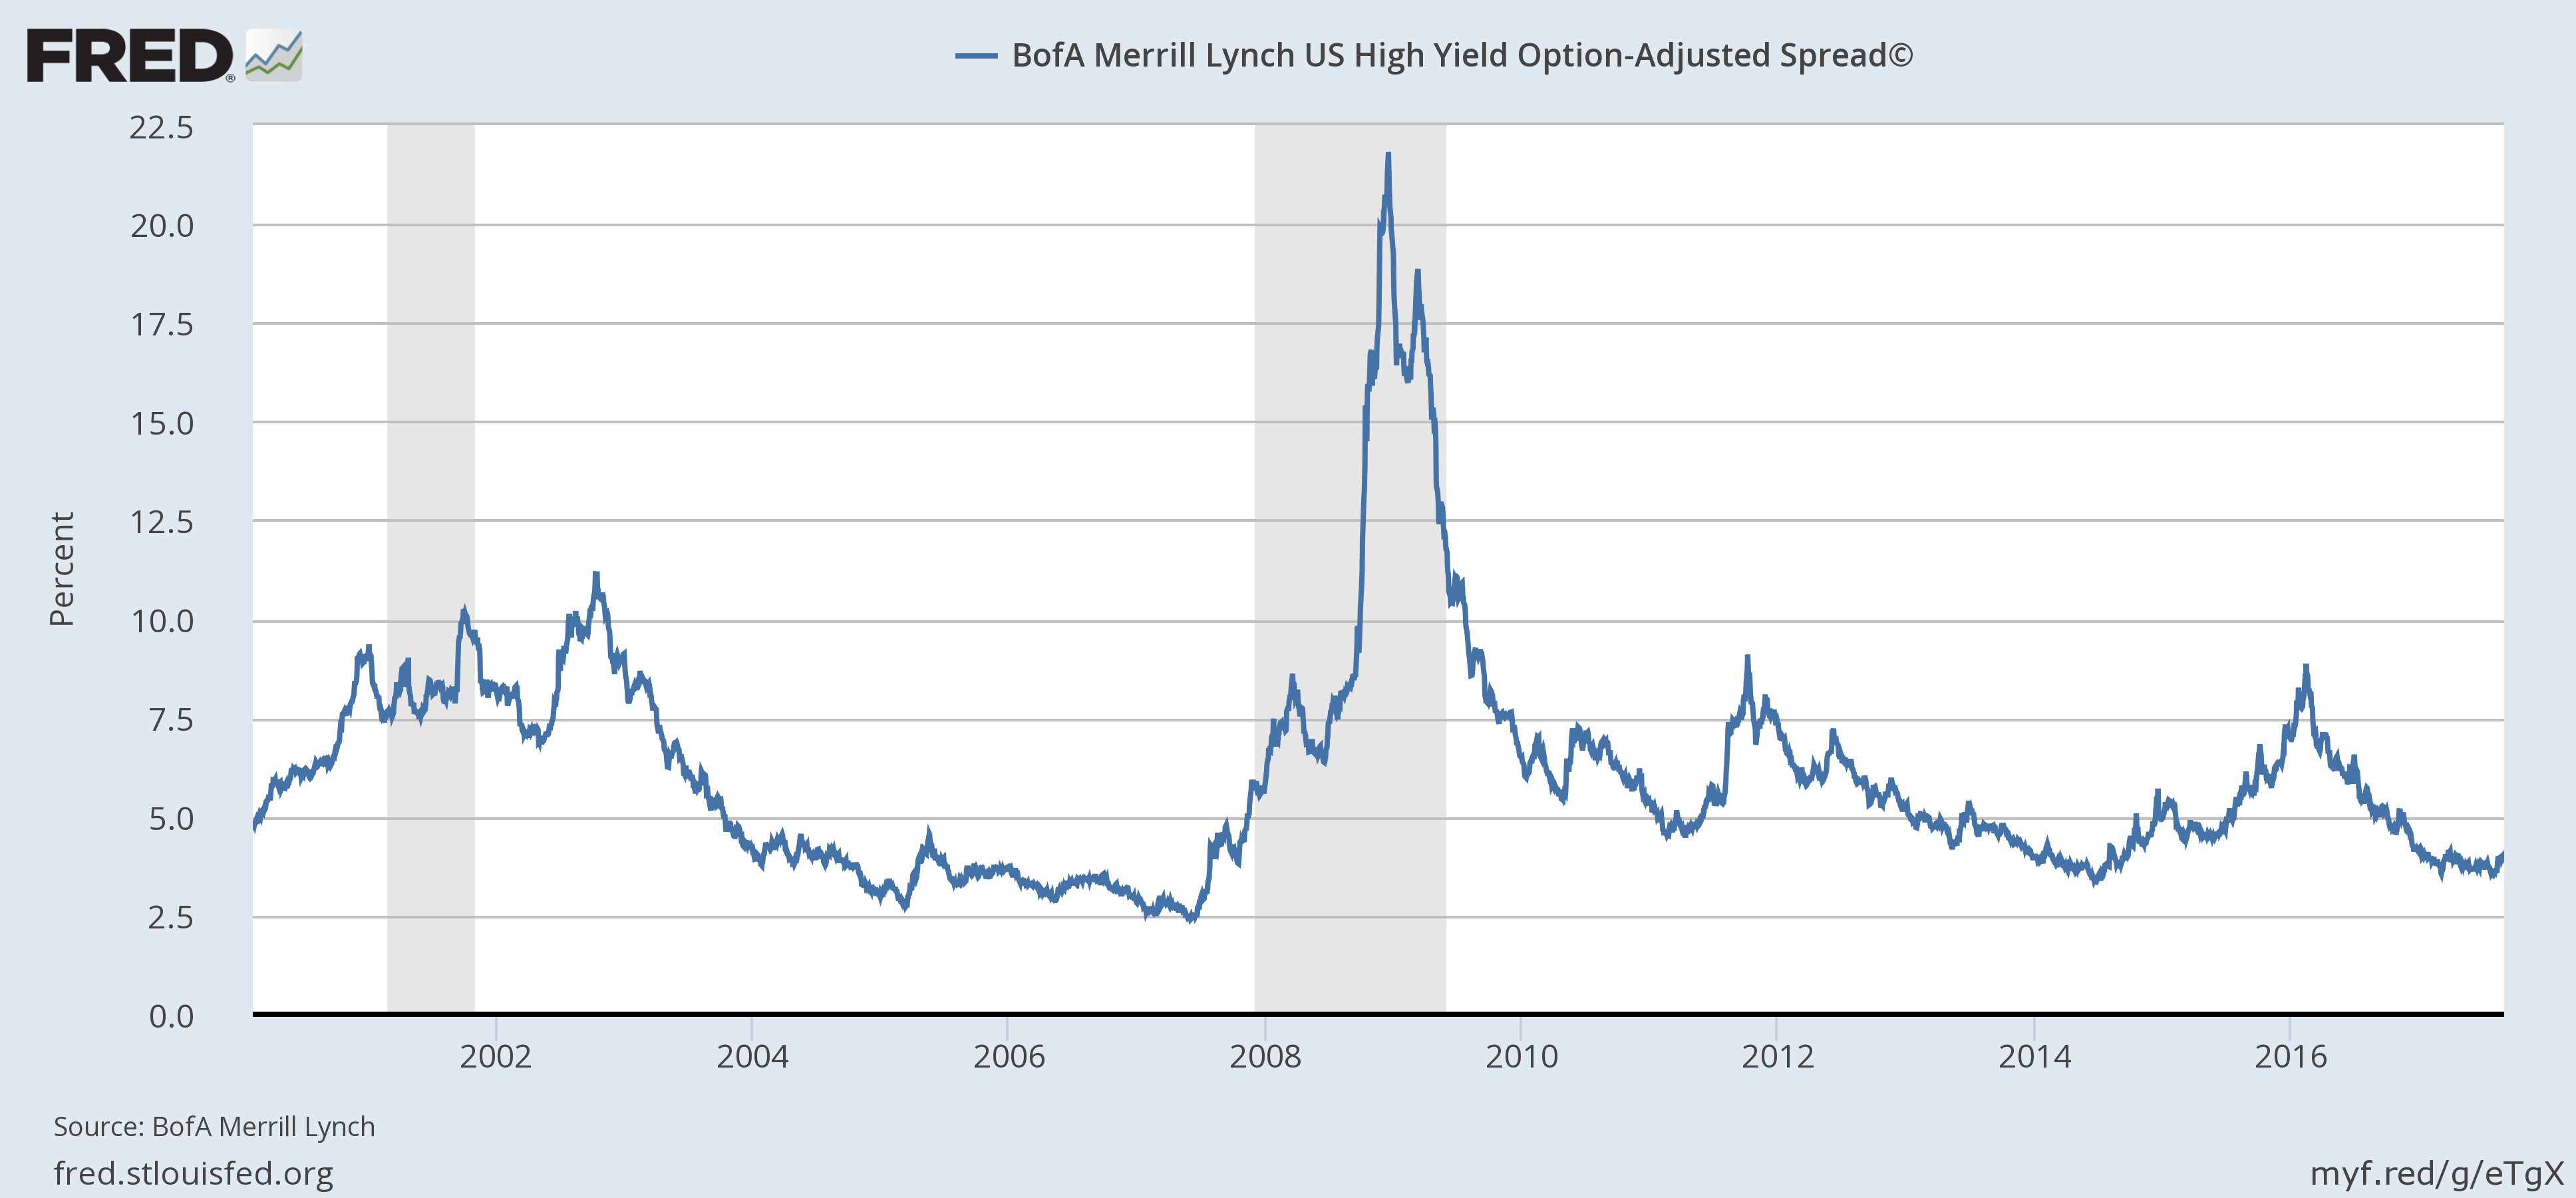
| Credit spreads actually narrowed a bit over the last two weeks (12 basis points) so risk appetite is still quite healthy. Have spreads seen their lows? I don’t know but there probably isn’t much upside from here; risk would seem to vastly outweigh potential reward. But spreads haven’t widened sufficiently form the recent low to warrant concern from an investment standpoint. |
BofA Merrill Lynch US High Yield Option, 2001 - 2017 |
The economic picture hasn’t changed. We are still stuck on the less than satisfying 2% growth path we’ve been on. I don’t see much reason to hope that is about to change for the better but ample reason to worry that it might for the worse. Economic policy is less than ideal and there seems little reason to believe it is about to improve. Republicans are desperate for a deal on taxes but Democrats have no reason to acquiesce and seem likely to continue playing the inequality card. With some justification I might add. Frankly, I think we might accomplish more with a robust application of anti-trust law than with tax cuts; both would be better. The Valley – Silicon – of the Oligarchs may think they can retain their status by bribing the hoi polloi with a universal basic income but I think most Americans would just prefer a job with some dignity. An Uber gig isn’t a job.
The Trump administration’s pursuit of a weak dollar is also paying predictable dividends. A quick review of history would have told President Trump that successful administrations are associated with a strong dollar not a weak one. There was certainly some pain from the recent strength of the dollar but providing relief to the world’s dollar debtors probably shouldn’t be a high priority for an American administration. A weak dollar policy – and I don’t see how anyone can see this as anything but – is an invitation to capital to seek more welcoming climes. And seek it does as the Euro and emerging market currencies climb steadily with the capital inflows. If risk capital prefers Brazil over the US what does that say about our economic policies? Nothing good that’s for sure.
The economy doesn’t appear to be getting significantly worse but “things aren’t getting worse” isn’t exactly a rallying cry. There are good things going on in the global economy though and we shouldn’t get too negative. Human ingenuity is limitless regardless of the obstacles presented by feckless politicians and nutjob dictators. There are worse things than a government that can’t get anything done. Gridlock shouldn’t be underestimated.
Tags: Alhambra Research,Bi-Weekly Economic Review,Bonds,cfnai,commodities,copper to gold ratio,credit spreads,currencies,durable goods orders,economic growth,economy,existing home sales,Featured,Federal Reserve/Monetary Policy,Gold,industrial production,Interest rates,Investing,Markets,New Home Sales,newslettersent,Politics,Retail sales,Taxes/Fiscal Policy,TIPS,US dollar,Yield Curve


