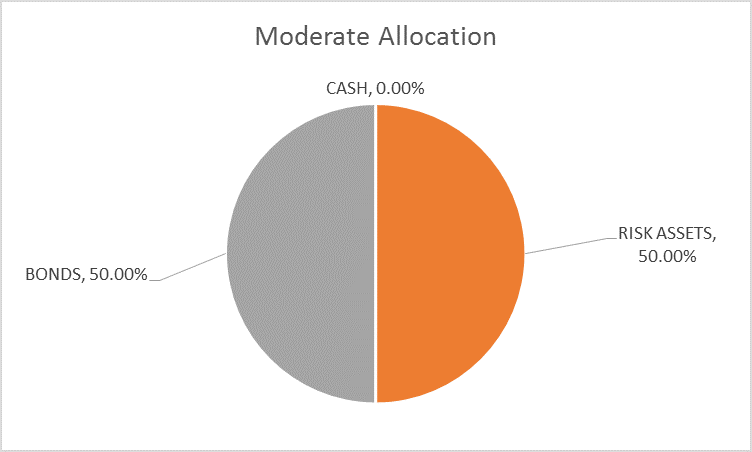
There is no change to the risk budget this month. For the moderate risk investor, the allocation between risk assets and bonds is unchanged at 50/50. There are, however, changes within the asset classes. We are reducing the equity allocation and raising the allocation to REITs. Based on the bond markets there has been little change in the growth and inflation outlook since the last asset allocation update. Based on the stock market – at least until yesterday – the future is so bright, simple shades won’t do; welding goggles are required. Well, at least that’s the view from the NASDAQ, which even after yesterday’s 2.5% shellacking is up over 3.5% in just the last month. Moderate Allocation - Click to enlarge
Topics:
Joseph Y. Calhoun considers the following as important: Alhambra Research, asset allocation, bonds, commodities, credit spreads, currencies, eafe, emerging markets, Featured, Global Asset Allocation, Global Asset Allocation Update, Gold, inflation, international bonds, international stocks, Investing, Markets, Model Portfolios, newsletter, Politics, Real estate, REITs, S&P 500, S&P 500, stocks, The United States, US dollar, Yield Curve
This could be interesting, too:
Investec writes The Swiss houses that must be demolished
Claudio Grass writes The Case Against Fordism
Nachrichten Ticker - www.finanzen.ch writes Die Performance der Kryptowährungen in KW 9: Das hat sich bei Bitcoin, Ether & Co. getan
Nachrichten Ticker - www.finanzen.ch writes Wer verbirgt sich hinter der Ethereum-Technologie?
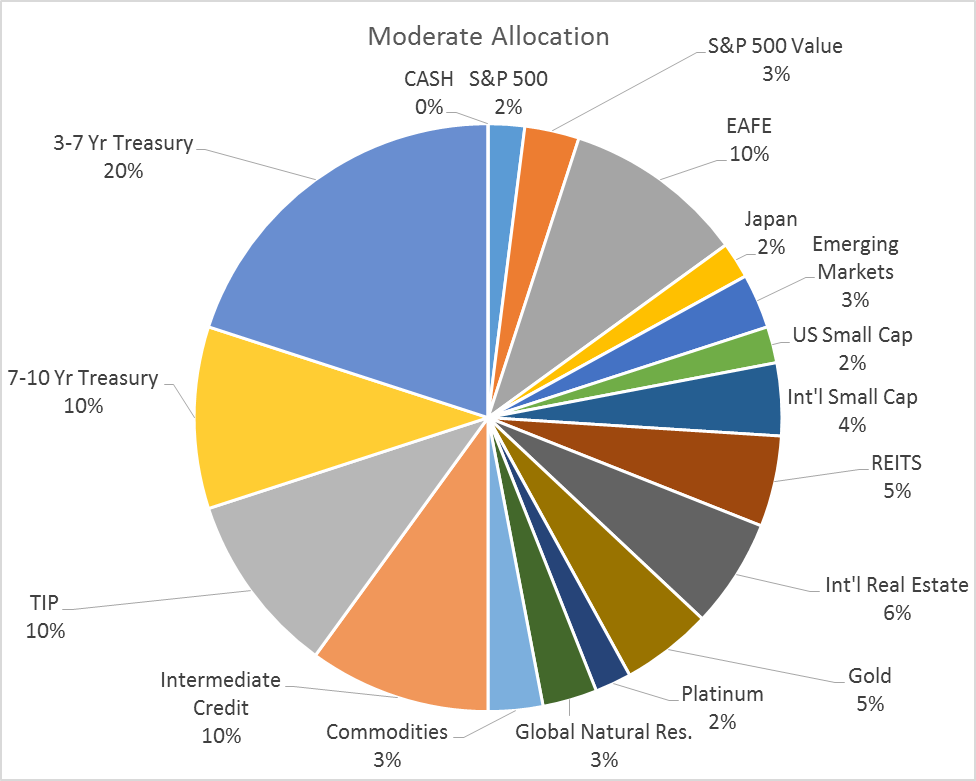
| There is no change to the risk budget this month. For the moderate risk investor, the allocation between risk assets and bonds is unchanged at 50/50. There are, however, changes within the asset classes. We are reducing the equity allocation and raising the allocation to REITs.
Based on the bond markets there has been little change in the growth and inflation outlook since the last asset allocation update. Based on the stock market – at least until yesterday – the future is so bright, simple shades won’t do; welding goggles are required. Well, at least that’s the view from the NASDAQ, which even after yesterday’s 2.5% shellacking is up over 3.5% in just the last month. |
Moderate Allocation |
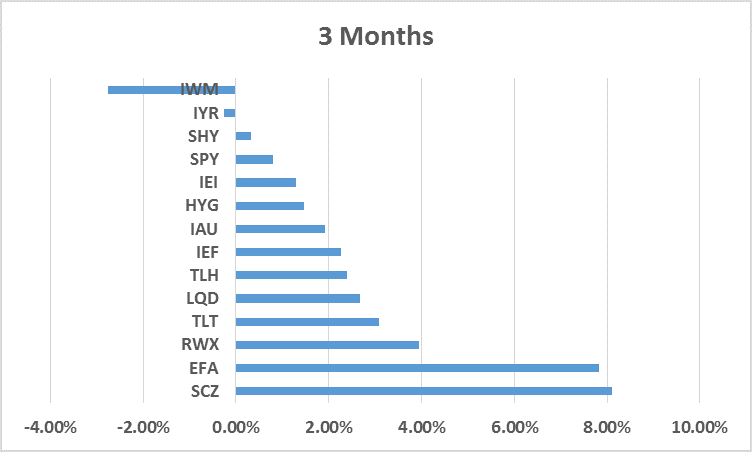
| Other than the tech stocks though, all the upside action was outside the US with Europe taking the lead. The French election, along with some improvement in European economic statistics, pushed European stocks up 9.3% in the last month. More generally, international stocks, as represented by the EAFE, were up a bit over 5%. EAFE small cap and emerging markets were also higher while the S&P 500 lagged, up just 0.3%. Foreign bonds were also leaders with developed market foreign bonds up the most (BWZ, +2.1%). Local currency EM bonds were also higher, continuing a trend that started right after the election sell-off. Three month returns are led by international stocks and US bonds followed by gold. Not exactly a ringing endorsement of the accelerating US economy meme. |
Allocation |
| Much of the outperformance of international markets was driven by the now falling dollar. The dollar index is down about 2.67% since the last update (-5.5% YTD) with the sell-off accelerating in lockstep with the political chaos that is the Trump administration. The overwhelming consensus coming into this year was that the dollar had to go higher because rates had to go higher (bonds down in price). Both of those widespread expectations were based, to some degree, on expectations that the new administration would be able to ride into town and get things done. It hasn’t exactly worked out that way as someone – see here, here, here, here, etc., etc. – has predicted repeatedly since the election. Almost all the rise in the dollar since election day has now been reversed. Bonds, I would point out, have quite a ways to go yet to achieve the same.
Our portfolios were positioned for a weak dollar outcome before the election although that wasn’t the reason for the tilt. We don’t generally spend a lot of time on elections because the reactions to them – positive or negative – are generally short lived. We were positioned for a weak dollar because we started to see a shift in long term momentum at the beginning of last year. Commodities – and particularly gold – were outperforming stocks for most of last year until the election. European outperformance started in the middle of last year, well before election day. Indeed, the election merely interrupted that trend as visions of tax cuts danced in investors’ heads. Now the previous trends are reasserting themselves as expectations for tax reform and other pro-growth measures in the US fade and the cyclical rebound overseas gains some momentum. I would point out however that market moves based on election results, as I just noted, are generally short lived. How long will it be before investors figure out that Macron is just the latest in a long line of French politicians who have failed to reform the sclerotic French economy? The honeymoon can probably last a while longer but investors will eventually figure out that the French are still French, the Italians still have better things to do than work and most of Europe is still not very happy about the immigrant problem. The upturn in the European economy is not based on some grand new approach to economic management. The EU is still a bureaucratic mess with high taxes, illiberal employment policies and one currency that works great for all of Europe within the German borders. But even the worst run economies have cyclical upturns and Europe is due and bouncing. Assuming the weak dollar trend continues, the emerging market upturn may be more substantial and longer lasting than Europe. Many of these smaller countries’ economies move with capital flows. As the dollar strengthens and capital flows out, their economies suffer. When the dollar weakens and capital flows in, their economies boom. I’m not predicting anything like a boom – yet – but some of these economies were hit so hard by the strong dollar that the bounce could be – in some cases already is – substantial. The latest on Brazilian political corruption could alter things but I doubt it. “President Accused of Taking Bribes” is now a keyboard shortcut on Brazilian computers. We’ve already seen an upturn in EM currencies and most of their central banks are now easing monetary policy. Once these things get going they can be self-reinforcing. Capital inflows drive the currency higher which suppresses inflation allowing the central bank to cut rates which stimulates the economy which attracts more capital inflows, etc. etc., until something happens to reverse the process and start the cycle all over again. As a long time Miami resident I’ve had a front row seat to this process for nearly three decades and so far this one is just like all the others I’ve traded. We added a position in EM stocks last July because they were cheap and the currencies were off their lows. The real asset side of our portfolio performed poorly despite the falling dollar. REITs and commodities were down over the trailing 1 and 3 month periods with general commodities performing the worst. Our allocation to platinum was a victim of waning US growth expectations as gold outperformed for the month. US REITs were lower while international real estate managed to squeak out a small return (RWX, +0.65%). Our allocation to natural resource stocks was a positive as it outperformed the commodity index but it was still down on the month (GNR, -0.45%). I am making a minor change to the allocation this month and shifting 2% from the S&P 500 to the international real estate ETF (RWX). We have been underweight real estate for some time based on US valuation concerns and because US REITs, while performing well, were not keeping up with the S&P 500. Now, with momentum shifting and the dollar falling, it seems logical to be overweight international real estate just as we are international stocks. Taking the 2% from the S&P 500 is just an acknowledgment that US stocks are pretty absurdly valued right now. If you aren’t willing to sell US stocks at these prices then you never will. At least not until they’ve gone down enough to scare you out of them. That is not a legitimate sell discipline by the way. I don’t see any imminent risks of recession from our market based indicators. That could change quickly but right now, recession does not appear imminent. |
U.S. Dollar, August 2016 - May 2017(see more posts on U.S. Dollar Index, ) |
| Credit Spreads – Credit spreads remain near the recent lows and show no signs of stress. Even in yesterday’s stock selloff spreads barely moved. Spreads continued to tighten well past the mid-December peak in inflation and real growth expectations. There was a slight widening until late March when tightening resumed. We are now again approaching the March lows but still above the June 2014 nadir for this cycle. Of course, it is when spreads are this low that one must be most careful. There is very little upside and a lot of downside in credit. |
U.S. High Yield Option, 2008 - 2017 |
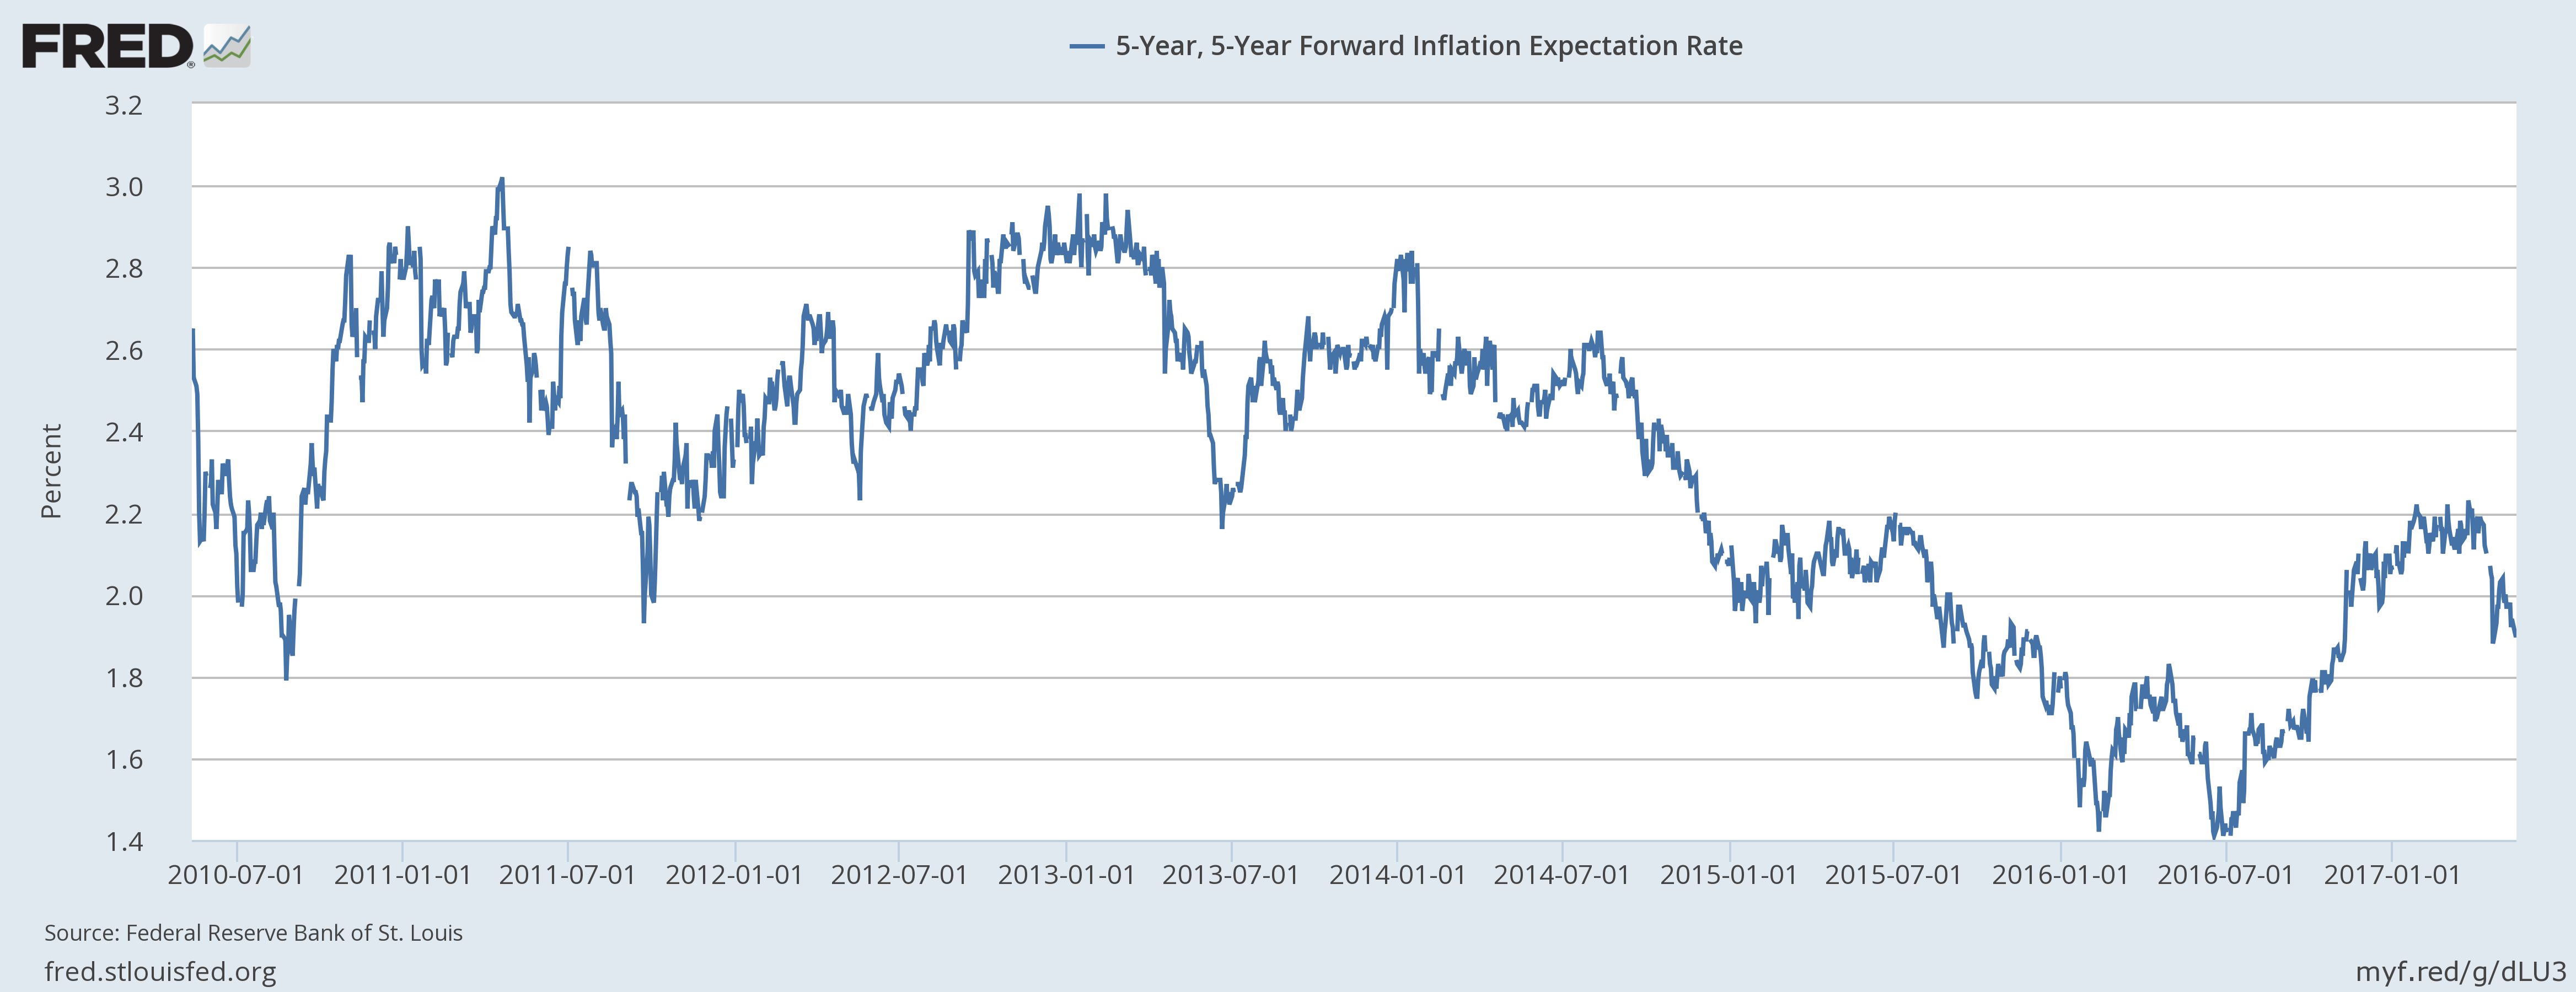
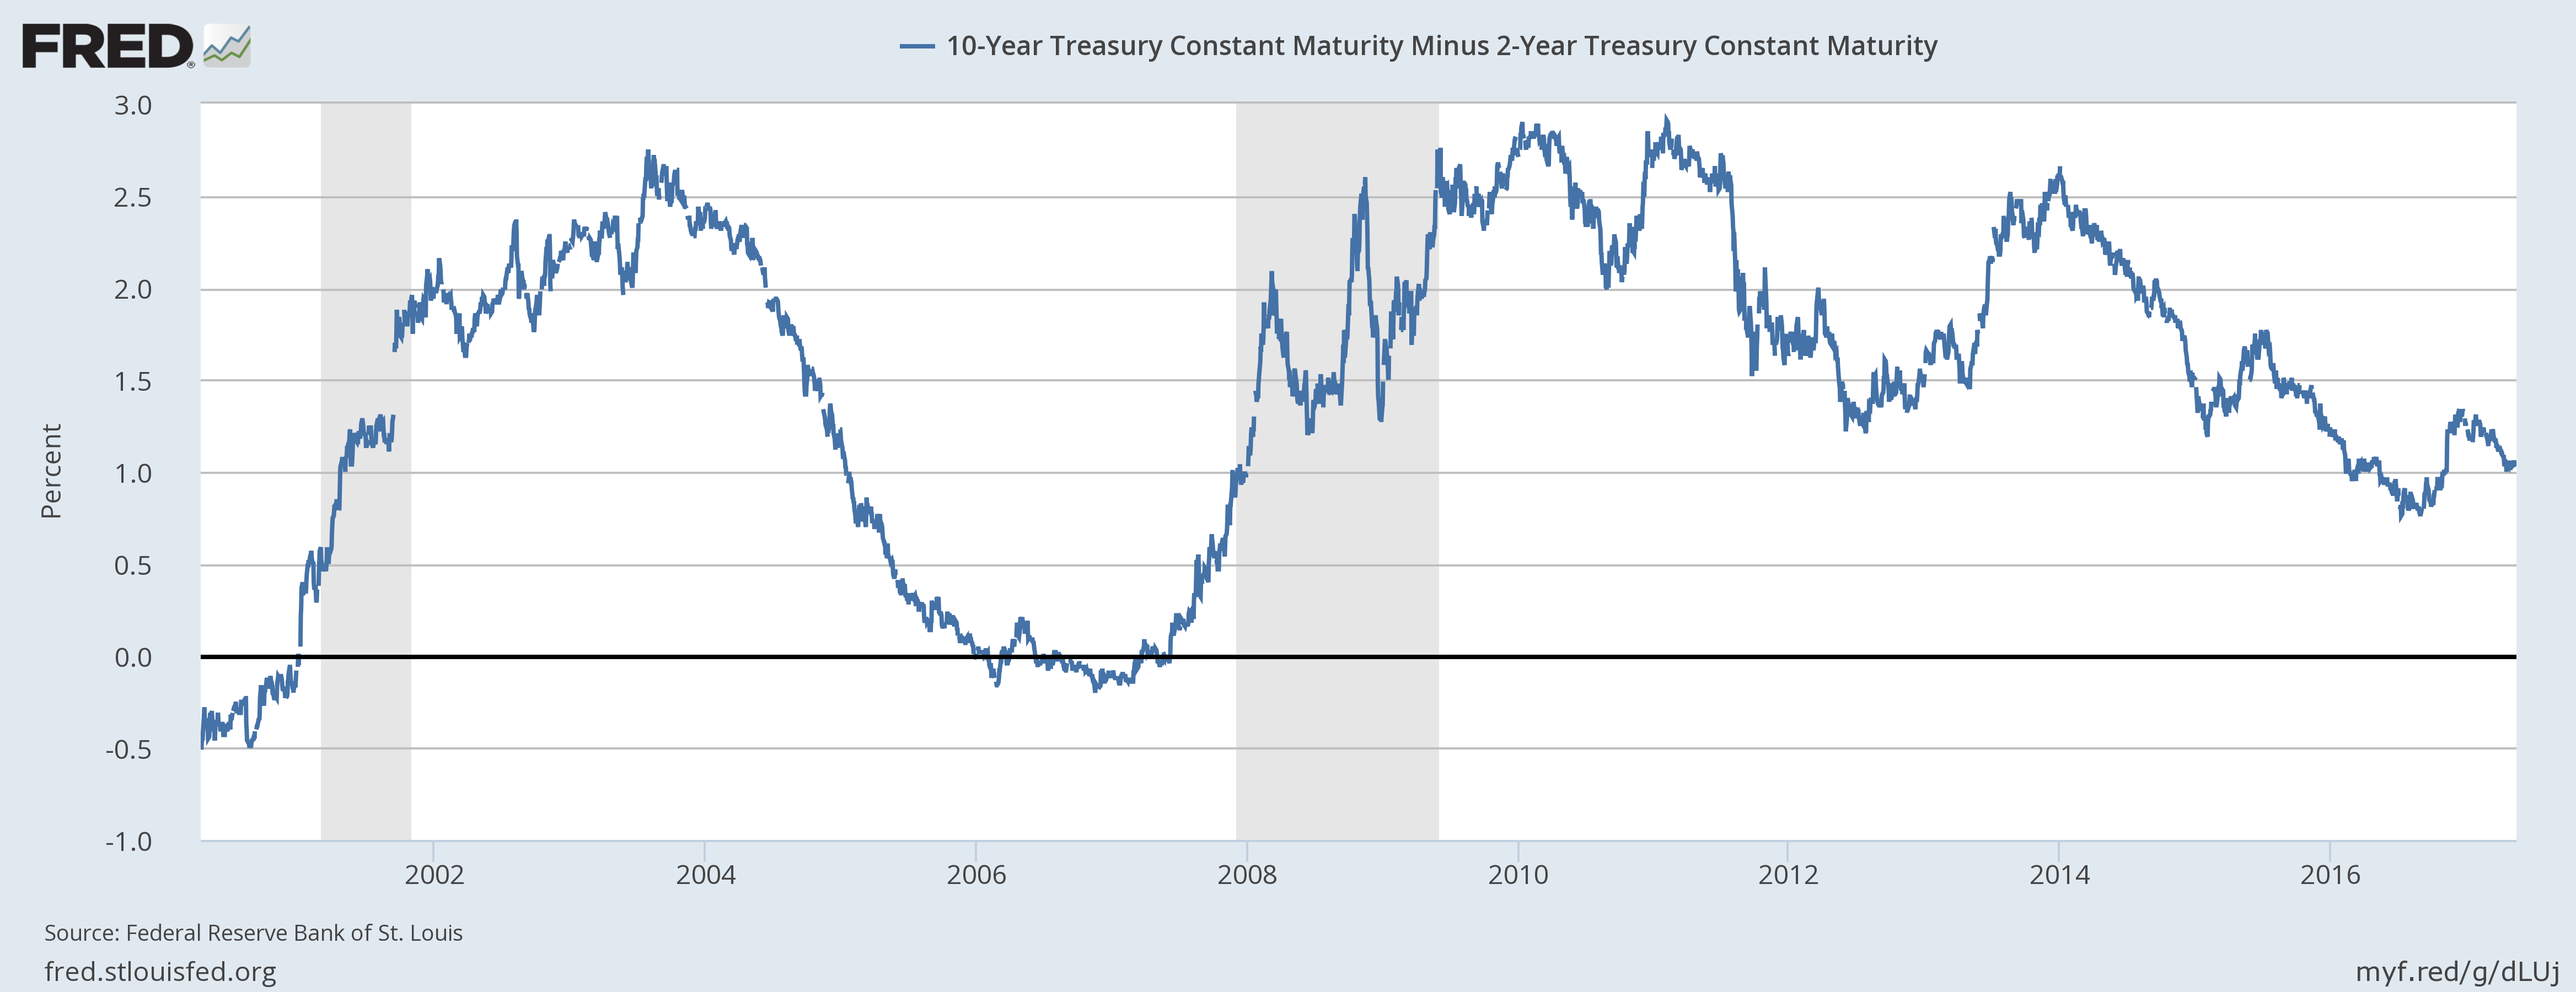
| Yield Curve – The curve flattened consistently from July ’15 to the end of August ’16 and then started to steepen. This flattening was due to short rates rising while long rates fell (Greenspan’s conundrum, otherwise known as the bond market reality check). As inflation expectations started to rise last summer, the curve started to steepen. Real growth expectations – TIPS yields – didn’t start rising until after the election and peaked in mid-December. More recently, the curve has resumed flattening as inflation expectations – and probably actual inflation – have peaked and started to fall again. TIPS yields rose since the last update however so the change in the yield curve is all due to the change in inflation expectations. The curve shows none of the classic signs of imminent recession.
Inflation expectations: |
Five Year Forward Inflation Expectation Rate, July 2010 - May 2017 |
| 10/2 Yield Curve: |
Treasure Constant Maturity |
| Valuations – It really doesn’t matter how you slice and dice the data, the answer is the same – US stocks are very expensive. Shiller P/E, Market cap/GDP, Price/Book, Price/Sales even forward P/E draw the same picture. Non-US stocks are cheaper although not much in some cases (Switzerland and Germany for instance). Emerging market stocks are cheapest and European EM stocks are the cheapest among those. We are overweight international but that is more a function of the dollar and momentum than valuation. But valuation matters from a risk perspective.
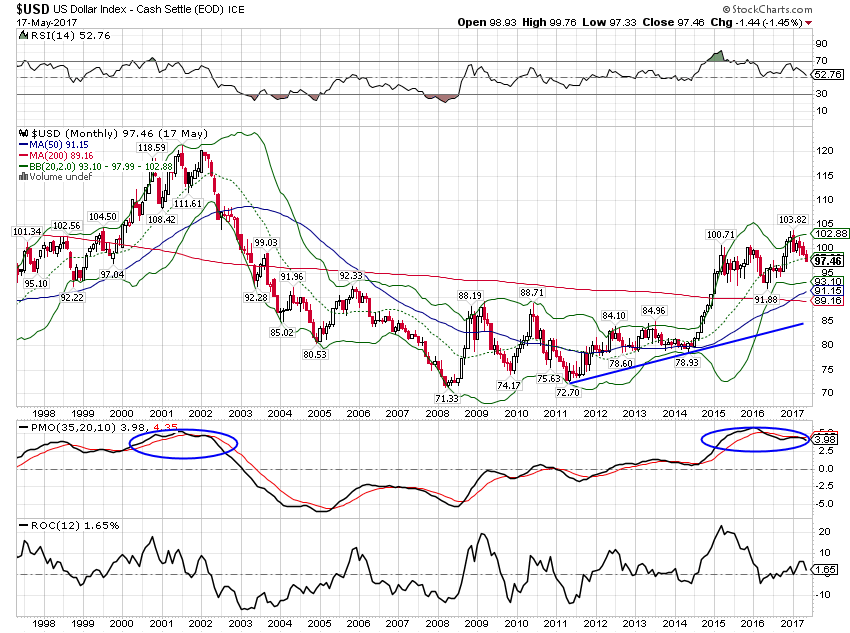
Dollar – Because we have an overweight to international the dollar is very important to our analysis right now. I have decided to include a section on the dollar going forward with these updates. Momentum peaked for the Dollar index in the first part of 2016 and while the rally after the election made new highs for price, momentum never confirmed the move. |
U.S. Dollar Monthly, 1998 - 2017(see more posts on U.S. Dollar Index, ) |
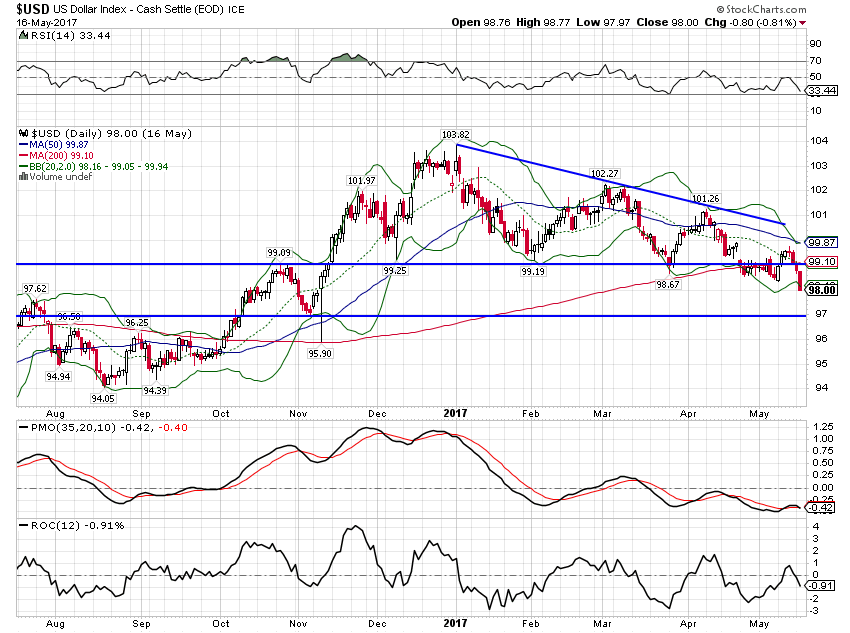
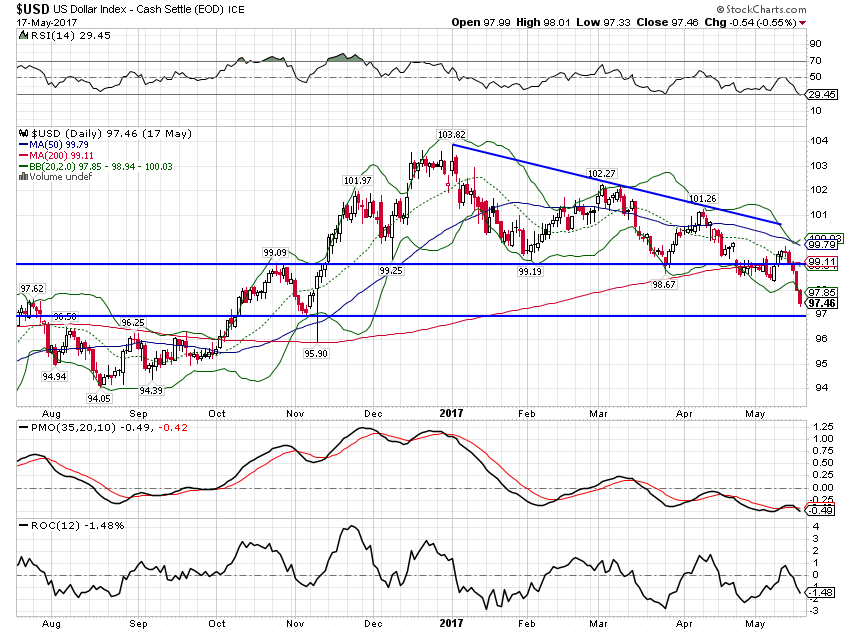
| On a shorter time frame, the Dollar index peaked in January and has been consistently trending lower since. The move since the last update solidified the trend with a decisive break under the 99 level. Now we are near support around 97 and a bounce would seem logical from these oversold levels. What might spur that retracement I can’t say but if part of the impetus for the move down was political than a move back up would seem to require a political victory for President Trump. On something. Anything. |
U.S. Dollar Daily, August 2016 - May 2017(see more posts on US dollar, ) |
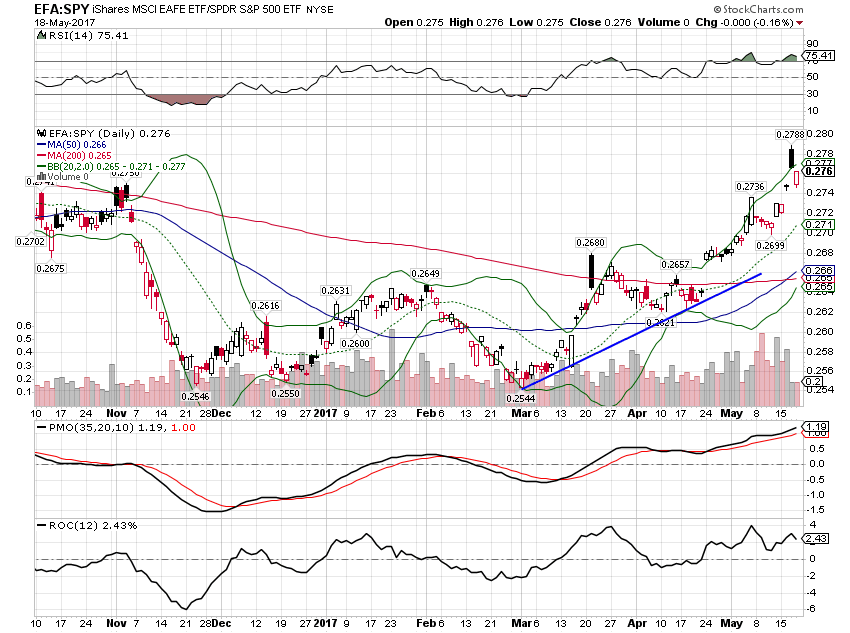
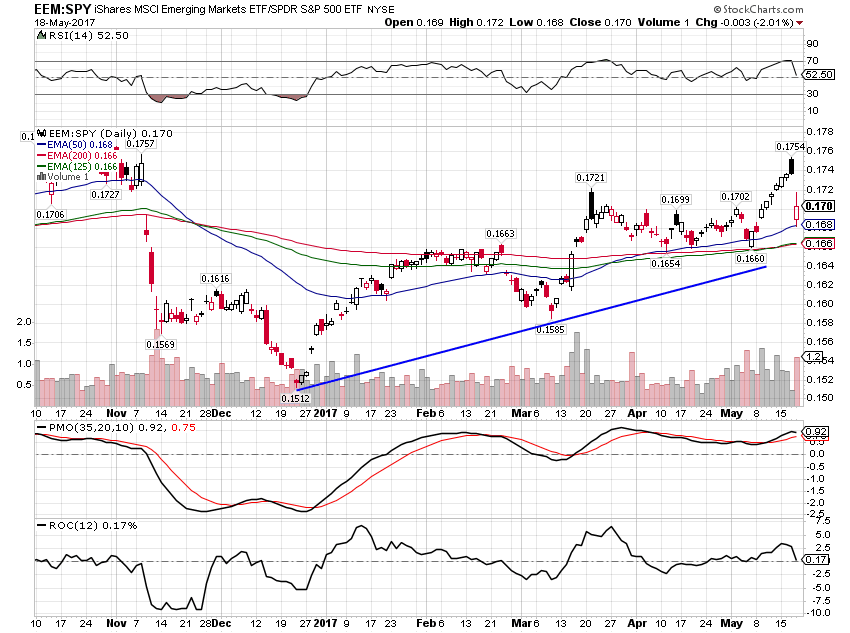
| Momentum: It is this move in the dollar that has driven the positive momentum of EFA and EEM versus SPY: |
EFA SPY, November 2016 - May 2017 |
EEM Spy Daily, November 2016 - May 2017 |
|
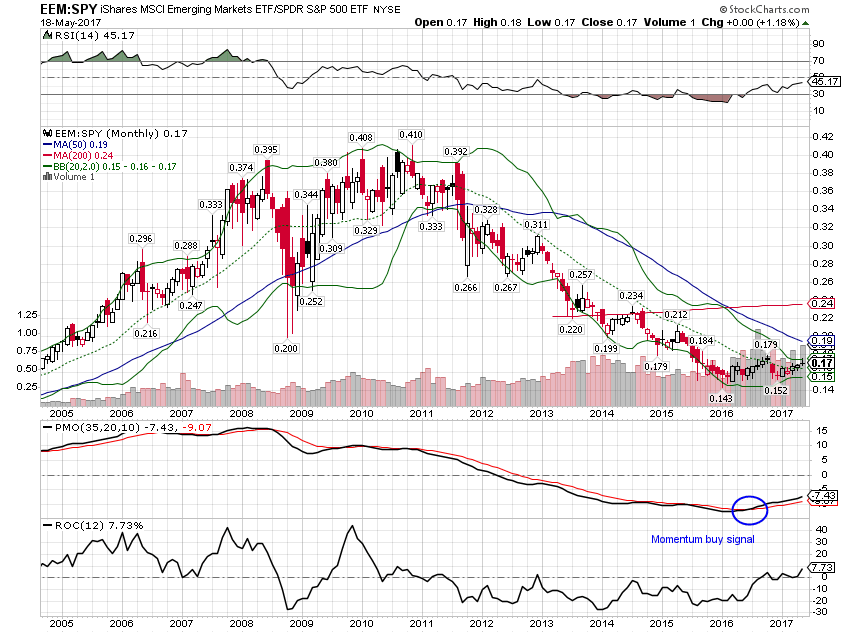
| These trends are still very early in their development as the US market has outperformed basically since the 2008 crisis but very strongly since the Euro crisis in 2011: |
EEM SPY, 2005 - 2017 |
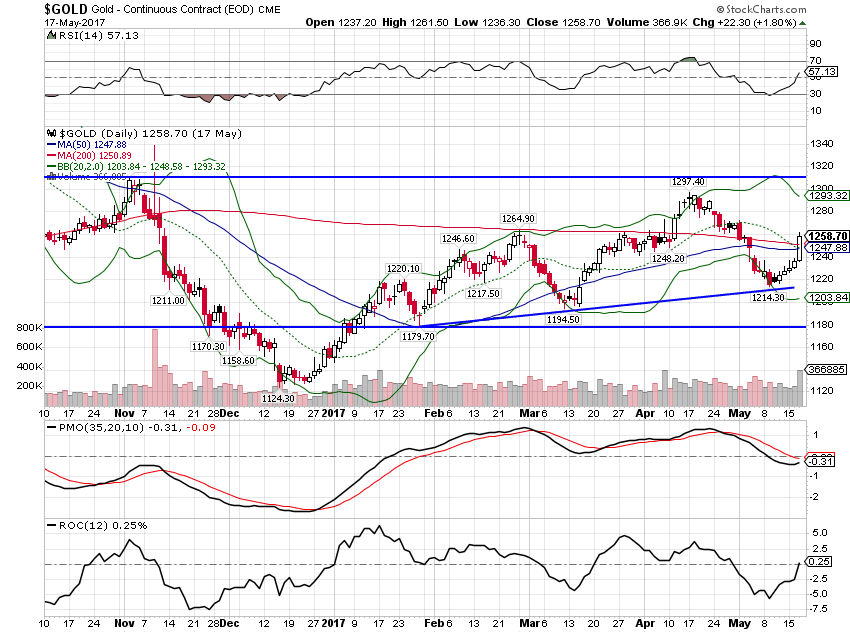
| Although it hasn’t performed well since the last update, gold is in an uptrend, supported by the weakening dollar: |
Gold Continuous Contract, November 2016 - May 2017(see more posts on Gold, ) |
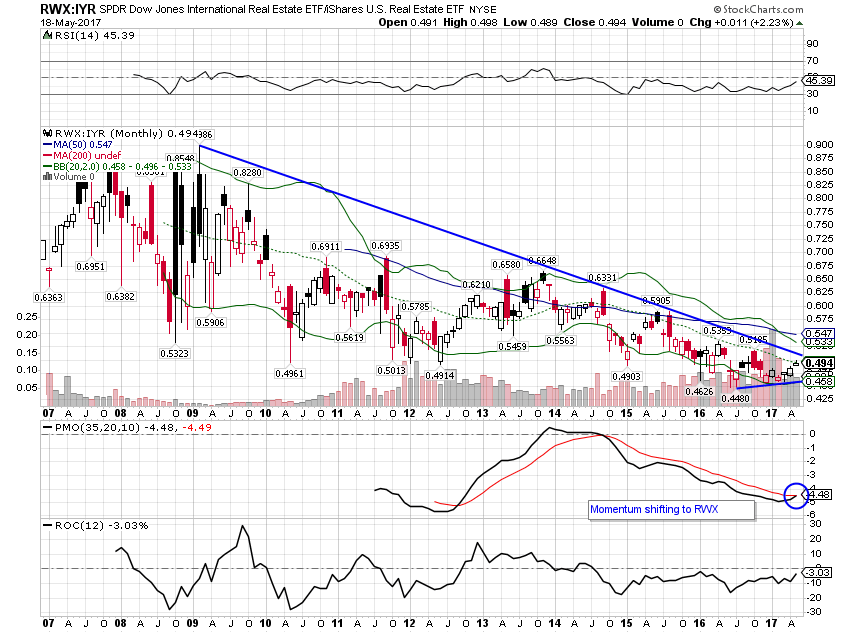
| International Real Estate has been an international laggard compared to EFA and EEM but outperformed US real estate since the last update. Momentum has already shifted to RWX on shorter time scales and is now doing so on the monthly chart: |
RWX IYR Monthly, July 2016 - May 2017 |
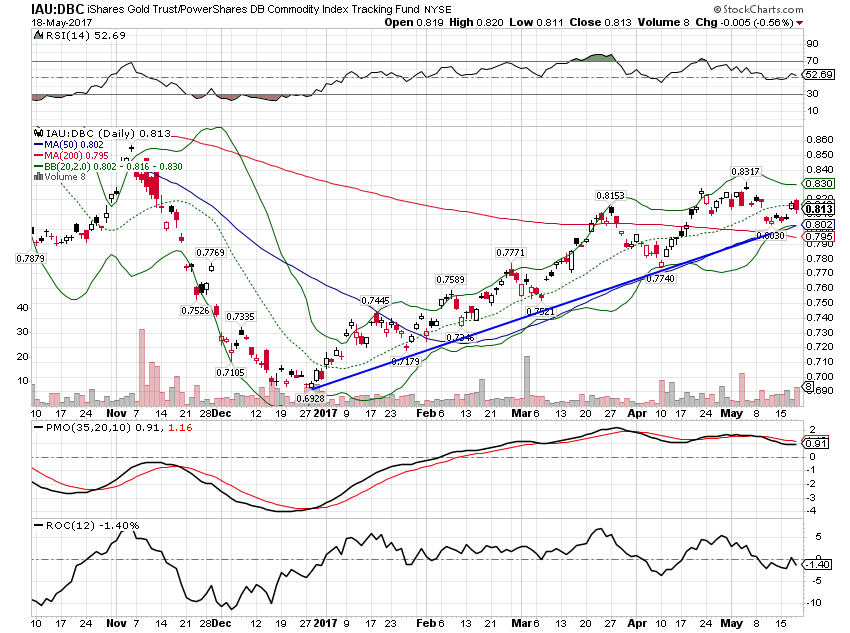
| In commodities, gold has been the leader, an confirmation of falling US growth expectations. |
IAU DBC, November 2016 - May 2017 |
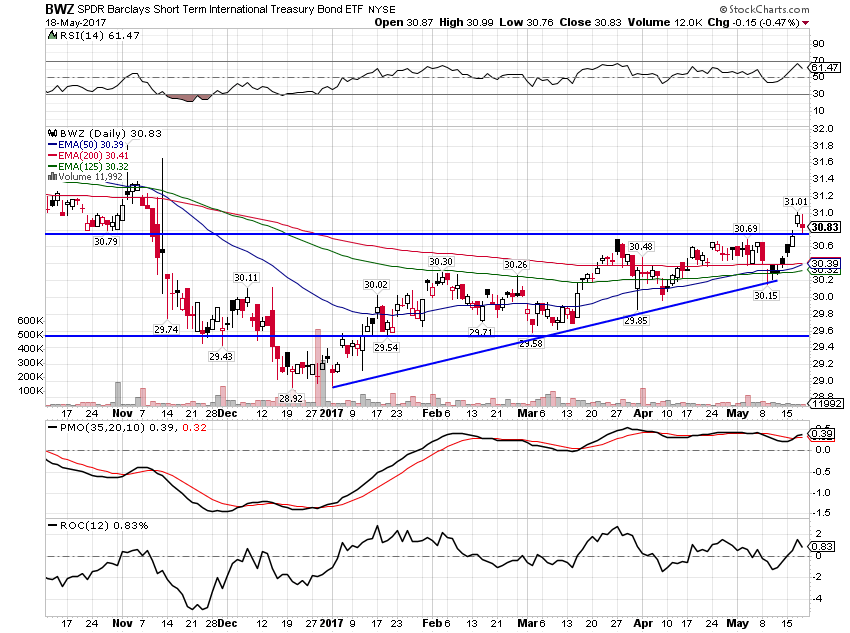
| As I mentioned earlier, international bonds are also outperforming, again a function of the weakening dollar: |
Barclays Short Term International Treasury Bond, November 2016 - May 2017 |
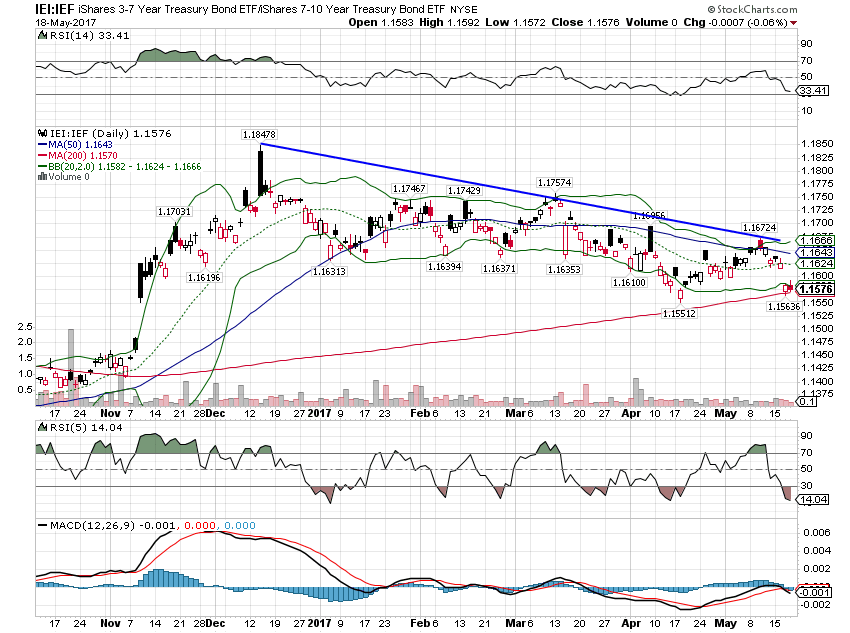
| And in Treasuries it is the long end of the curve outperforming the short end as the Fed hikes rates and bond traders refuse to go along. The curve flattens: |
Treasury Bond, November 2016 - May 2017(see more posts on U.S. Treasuries, ) |
| US growth expectations continue to wane relative to the rest of the world pushing the dollar lower. Politics are also involved though and if you think predicting the economy is difficult try your hand at political prognosticating. I have no idea what will ultimately happen with the latest Trump bashing du jour. I do think that a weak President makes a weak currency and right now we’ve got lots of evidence to support that thesis. Tax reform? I said right after the election that it was a 2018 event at the earliest. I think that might have been too optimistic.
The new Alhambra Moderate Allocation: |
Moderate Allocation |
Tags: Alhambra Research,Asset allocation,Bonds,commodities,credit spreads,currencies,eafe,Emerging Markets,Featured,Global Asset Allocation,Global Asset Allocation Update,Gold,inflation,international bonds,international stocks,Investing,Markets,Model Portfolios,newsletter,Politics,Real Estate,REITs,S&P 500,stocks,US dollar,Yield Curve

