Swiss Franc Currency Index The Swiss Franc index remained in its ranges. It is now trending downwards, while the dollar index is strengthening Trade-weighted index Swiss Franc, March 04(see more posts on Swiss Franc Index, ) Source: markets.ft.com - Click to enlarge Swiss Franc Currency Index (3 years) The Swiss Franc index is the trade-weighted currency performance (see the currency basket)On a three years interval, the Swiss Franc had a weak performance. The dollar index was far stronger. The dollar makes up 33% of the SNB portfolio and 25% of Swiss exports (incl. countries like China or Arab countries that use the dollar for exchanges). Contrary to popular believe, the CHF index gained only 1.73% in 2015. It lost 9.52% in 2014, when the dollar (and yuan) strongly improved. Swiss Franc Currency Index (3 years), March 04(see more posts on Swiss Franc Index, ) Source: markets.ft.com - Click to enlarge USD/CHF The pendulum of market sentiment swung hard and fast toward a Fed rate hike in the middle of March. The signals from Fed officials, including Governor Brainard and Powell, spurred the move. According to Bloomberg, the market had discounted a 90% chance of a hike before Yellen and Fischer spoke. A week ago, Bloomberg calculations showed a 40% chance of a move.
Topics:
George Dorgan considers the following as important: Australian Dollar, Bollinger Bands, British Pound, Canadian Dollar, Crude Oil, EUR-USD, EUR/CHF, Euro, Euro Dollar, Featured, FX Trends, Japanese Yen, MACDs Moving Average, newslettersent, RSI Relative Strength, S&P 500 Index, S&P 500 Index, Stochastics, Swiss Franc Index, U.S. Treasuries, US Dollar Index, USD/CHF, USDJPY
This could be interesting, too:
Nachrichten Ticker - www.finanzen.ch writes Die Performance der Kryptowährungen in KW 9: Das hat sich bei Bitcoin, Ether & Co. getan
Nachrichten Ticker - www.finanzen.ch writes Wer verbirgt sich hinter der Ethereum-Technologie?
Marc Chandler writes March 2025 Monthly
Mark Thornton writes Is Amazon a Union-Busting Leviathan?
Swiss Franc Currency IndexThe Swiss Franc index remained in its ranges. It is now trending downwards, while the dollar index is strengthening |
Trade-weighted index Swiss Franc, March 04(see more posts on Swiss Franc Index, )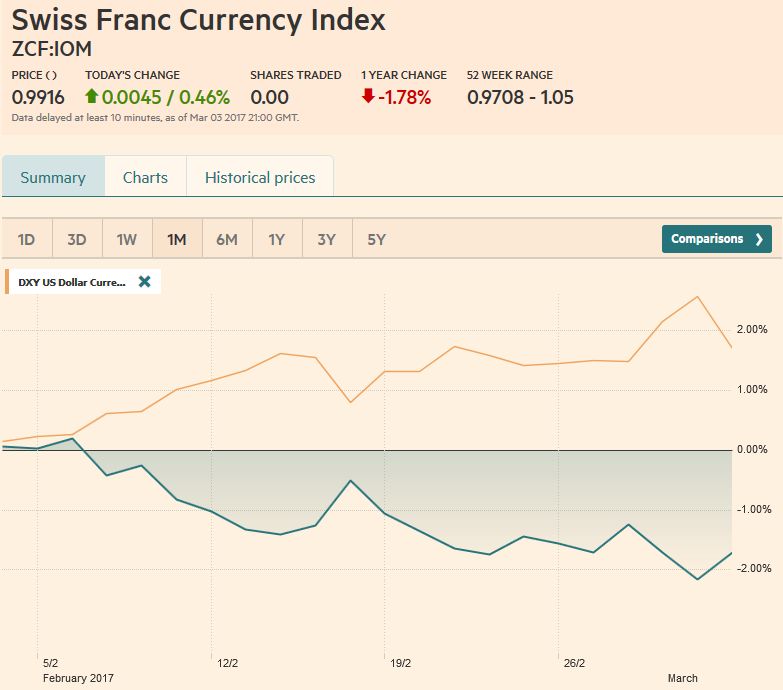 Source: markets.ft.com - Click to enlarge |
Swiss Franc Currency Index (3 years)The Swiss Franc index is the trade-weighted currency performance (see the currency basket)On a three years interval, the Swiss Franc had a weak performance. The dollar index was far stronger. The dollar makes up 33% of the SNB portfolio and 25% of Swiss exports (incl. countries like China or Arab countries that use the dollar for exchanges).
|
Swiss Franc Currency Index (3 years), March 04(see more posts on Swiss Franc Index, )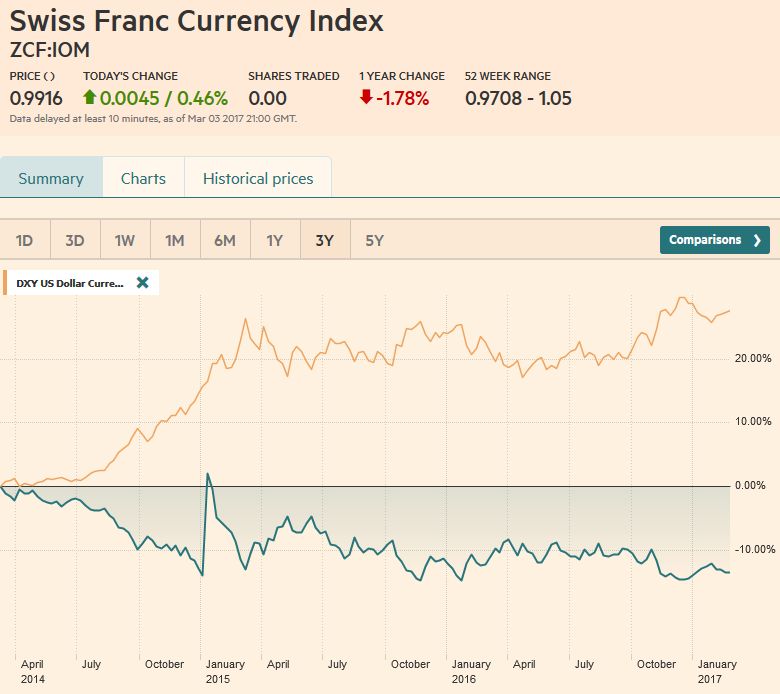 Source: markets.ft.com - Click to enlarge |
USD/CHFThe pendulum of market sentiment swung hard and fast toward a Fed rate hike in the middle of March. The signals from Fed officials, including Governor Brainard and Powell, spurred the move. According to Bloomberg, the market had discounted a 90% chance of a hike before Yellen and Fischer spoke. A week ago, Bloomberg calculations showed a 40% chance of a move. Buy the rumor sell the fact activity made for dramatic pullback in the dollar in the US afternoon before the weekend. It likely squeezed out some weak longs.
The key issue is whether, with a US hike nearly fully discounted, it can still be a dollar driver, and if not, what replaces it. We think these questions lend themselves to choppy activity in the first part of the week ahead, and suspect the greenback can rally on a strong jobs report, especially if wage growth picks up again. The market seems to have altered the timing of the Fed’s move more than the pace. We suspect that the market will move to discount a greater chance that the Fed delivers a third hike this year, only a third of which has been discounted. |
US Dollar/Swiss Franc FX Spot Rate, March 04(see more posts on USD/CHF, )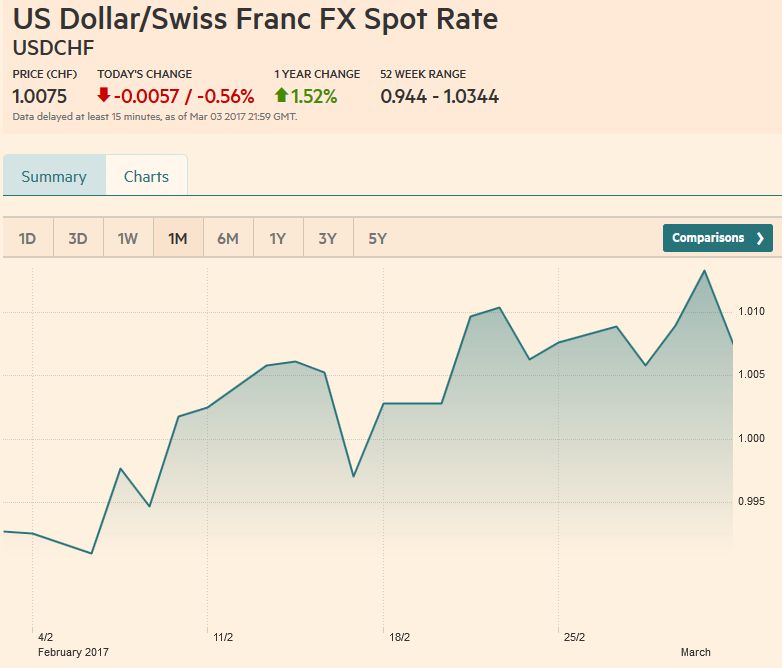 Source: markets.ft.com - Click to enlarge |
US Dollar IndexThe Dollar Index gained 0.3% of a percent last week, with the early gains cut in half in the sell-off that took place in the last few hours of activity. It reached 102.25 at its peak, its highest level since January 11, and surpassed the 61.8% retracement of the down move since the January 3 peak (found a little above 102.05). The upper Bollinger Band comes in near there as well. A break of the 20-day moving average, which caught the lows in the second half of February may be the signal that this leg up that began in early February near 99.20 is over. The 20-day moving average is near 101.
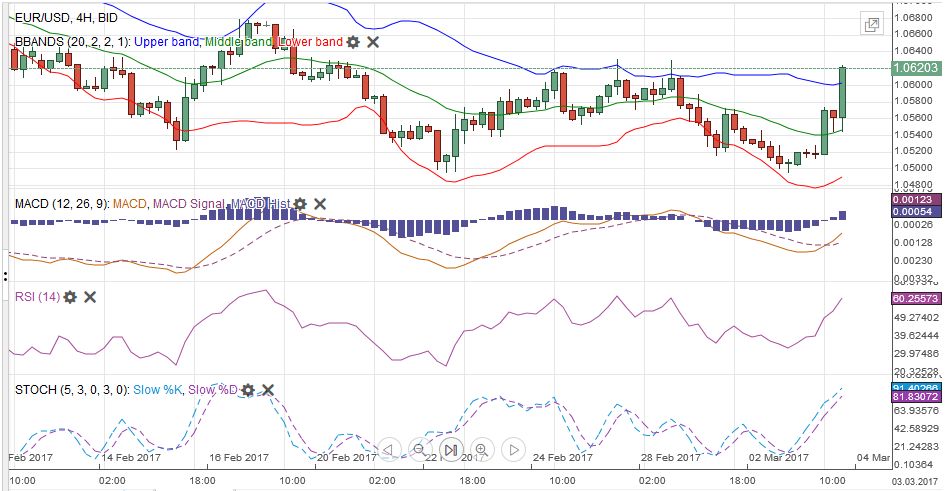
A late short squeeze prevented the euro from falling for a fourth week against the dollar. It was the second weekly gain in the past six. It had frayed the lower end of its recent range near $1.05 to test the lower Bollinger Band. It completed the 61.8% retracement of the January rally (~$1.0525). It was squeezed higher ahead of the weekend and entered a technically important area 1.0600-$1.0630. A move above it suggests the February losses have run their course. The area houses the 20-day moving average (~$1.0610), the 38.2% retracement of the recent decline (~$1.0620) and the late February high (~$1.0630).
|
US Dollar Currency Index, March 04(see more posts on U.S. Dollar Index, )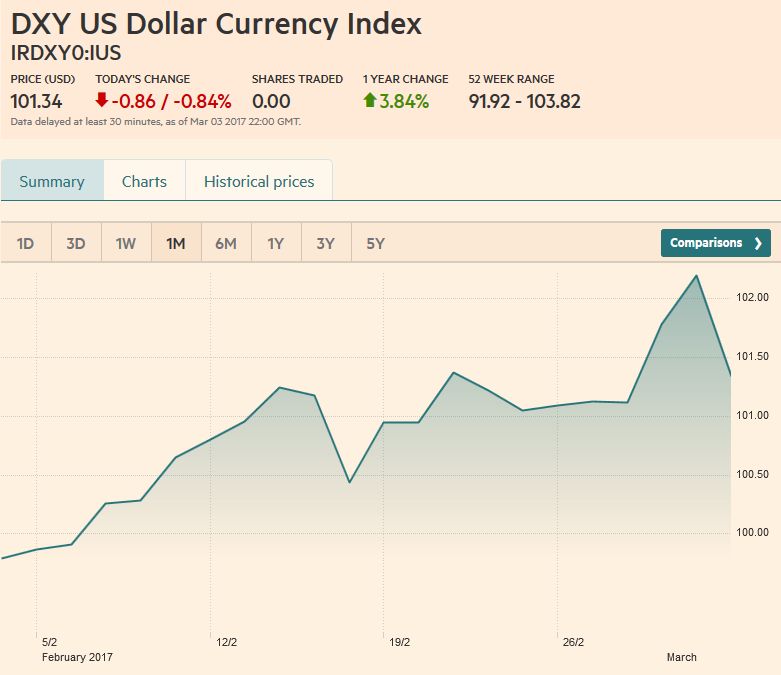 Source: markets.ft.com - Click to enlarge |
EUR/USDThe US two-year premium over Germany widened for the sixth consecutive week. Over this span, it has widened by about 30 bp. The US 10-year premium over Japan fell throughout February but jumped 18 bp last week to the widest since January 25. The dollar rose 1.7% against the yen was the largest since the middle of December. The setback ahead of the weekend snapped a four-day rally.
|
EUR/USD with Technical Indicators, February 27-March 04(see more posts on Bollinger Bands, EUR / USD, MACDs Moving Average, RSI Relative Strength, Stochastics, ) |
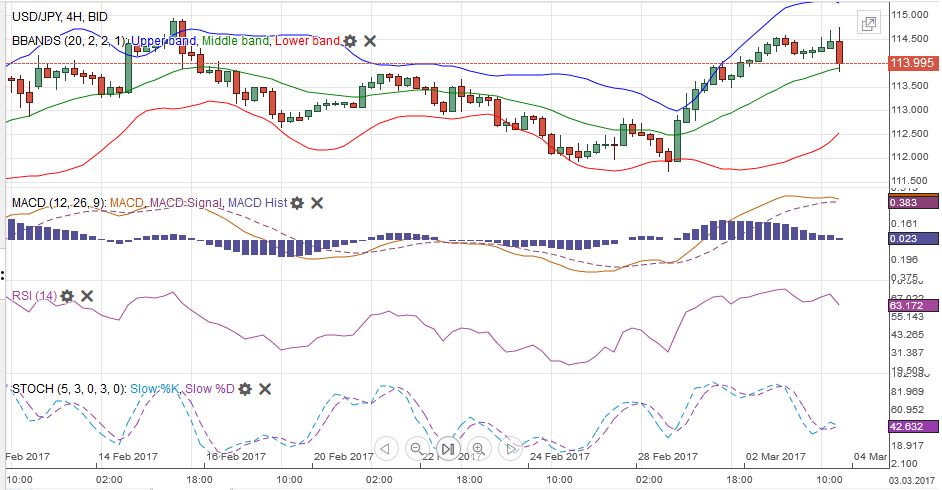
USD/JPYWhile other currencies broke out of their ranges, as we discuss below, the yen (and euro) are not among them. The dollar needs to rise above JPY115.00, and even then, some might not be convinced until JPY115.60 is paid. The neckline of the double bottom near JPY111.60 is found near JPY115.00, which also corresponds to the 50% retracement objective of this year’s decline. The 61.8% retracement is near JPY116.00. The minimum measuring objective of the double bottom is around JPY118.50. The dollar closed the week on near its lows, a little above JPY114.00 |
USD/JPY with Technical Indicators, February 27-March 04(see more posts on Bollinger Bands, MACDs Moving Average, RSI Relative Strength, Stochastics, USD/JPY, ) |
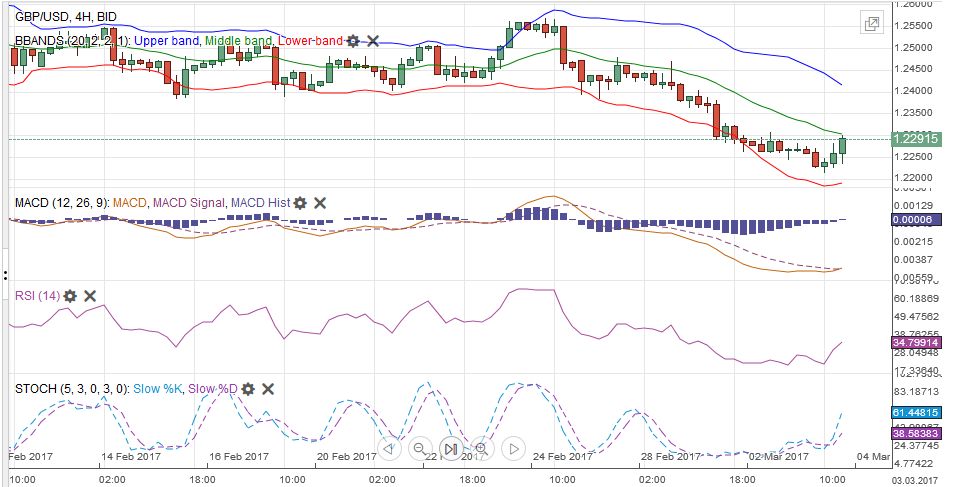
GBP/USDSterling snapped a five-day slide against the dollar. It is not just Brexit, which has not been particularly helpful as the House of Lords approved an amendment to the bill (protecting the rights of EU citizen in the UK). Sterling is not immune from the same forces that are weighing on other major currencies, the rising interest premium offered by the US. In both two- and 10-year tenors, the US premium is at new extremes. The UK’s PMIs for February were disappointing and pointed to a moderation in the economy in Q1. The composite was 53.8 compared with a 55.6 monthly average in Q4 16. Unlike the euro and yen, sterling did break out of its range, and since it took out the $1.24 floor, it has not looked back. New lows were recorded before the weekend near $1.2215. It closed below the lower Bollinger Band two consecutive sessions before edging back into it before the weekend. It is true that sometimes the Bollinger Band moves to prices rather than prices moving to the Bollinger Band, but it illustrates that the short-term market may be stretched. Sterling’s downside momentum seemed to stall after meeting the 61.8% retracement objective of the recovery since the dip below $1.20 in January, which came in near $1.2260. The old floor at $1.24 now becomes important resistance, though, before it, we suspect a recovery from the current stretched condition will be more limited. |
GBP/USD with Technical Indicators, February 27 - March 04(see more posts on Bollinger Bands, GBP/USD, MACDs Moving Average, RSI Relative Strength, Stochastics, ) |
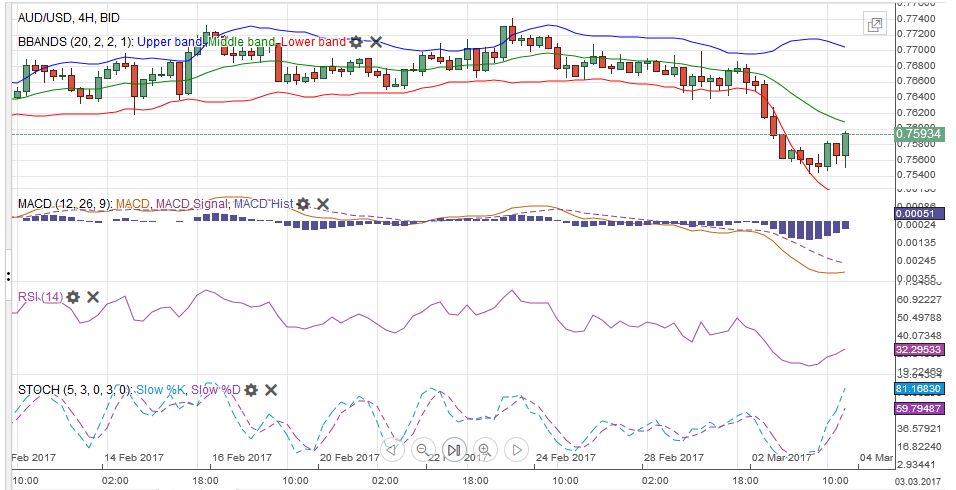
AUD/USDThe Australian dollar lost about 1.0% last week and convincingly broke out of its one-cent range ($0.7600-$0.7700). The measuring objective puts it closer to $0.7500, while the 38.2% retracement objective of this year’s rally is near $0.7520. The five-day moving average crossed below the 20 day average of the first time since mid-January. The Australian dollar looked stretched and enjoyed a good bounce in the US afternoon before the weekend. We look for stale longs to use the bounce to get liquidated. The $0.7600-$0.7620 offers resistance.
|
AUD/USD with Technical Indicators, February 27 - March 04(see more posts on Australian Dollar, Bollinger Bands, MACDs Moving Average, RSI Relative Strength, Stochastics, ) |
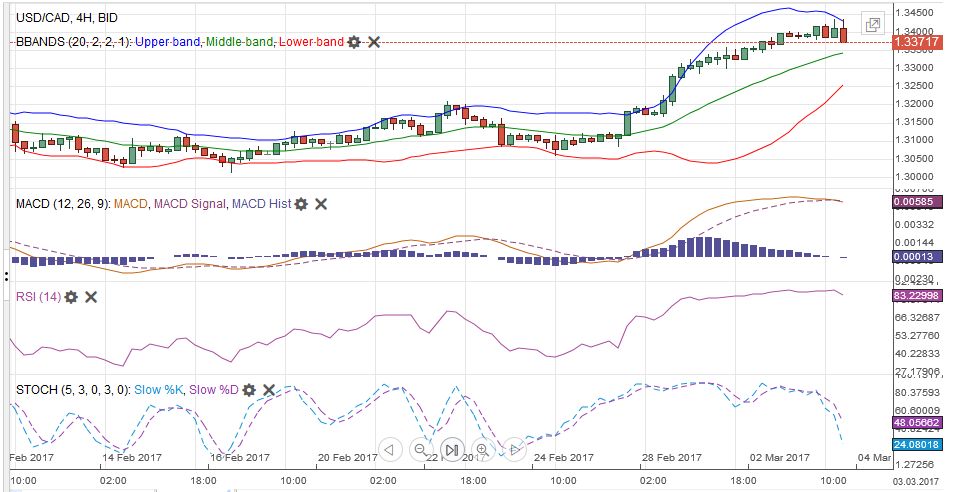
USD/CADThe US dollar rose 2.1% against the Canadian dollar last week, which is one of the biggest advances since last May. The dollar had been in a CAD1.30 to the CAD1.32 range. It broke to the upside as we anticipated and quickly met the |
USD/CAD with Technical Indicators, February 27 - March 04(see more posts on Bollinger Bands, Canadian Dollar, MACDs Moving Average, RSI Relative Strength, Stochastics, ) |
Crude OilOil did not breakout last week. The April contract remains in a $52-$55 range. The 100-day moving average (~$52.55) offered support in the second half of last week. The Bollinger Bands ($52.60-$54.75) are essentially the range. News of a continued build in US inventories, output, and rig count offset news that OPEC continued to reduce output in February. |
Crude Oil, Mar 2016 - Mar 2017(see more posts on Crude Oil, )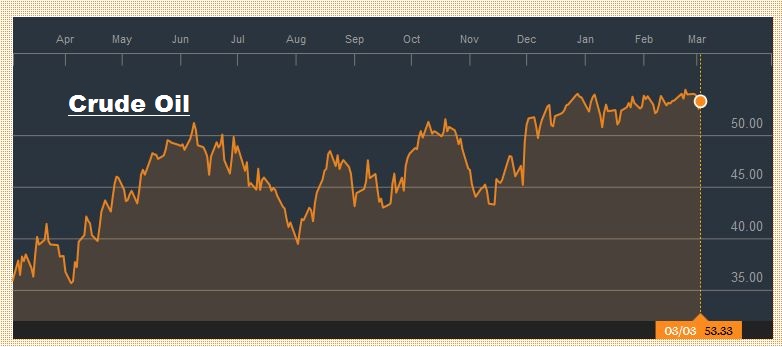 Source: Bloomberg.com - Click to enlarge |
U.S. TreasuriesThe US 10-year note yield rose every session last week, but it did not break out of its range. Consider that the December high yield print was near 2.64%. The high in January was 2.55% and last month’s high was 2.52%. Before the weekend, perhaps helped by a stronger than expected rise in the non-manufacturing ISM, the 10-yield reached almost 2.52%. However, it could not sustain the gains. The trend line drawn off the yield highs comes in near 2.50%. It closed at 2.48%. The technical indicators are bearish for the note futures even though last month’s low near 123-24 has not been broken. |
Yield US Treasuries 10 years, Mar 2016 - Mar 2017(see more posts on U.S. Treasuries, )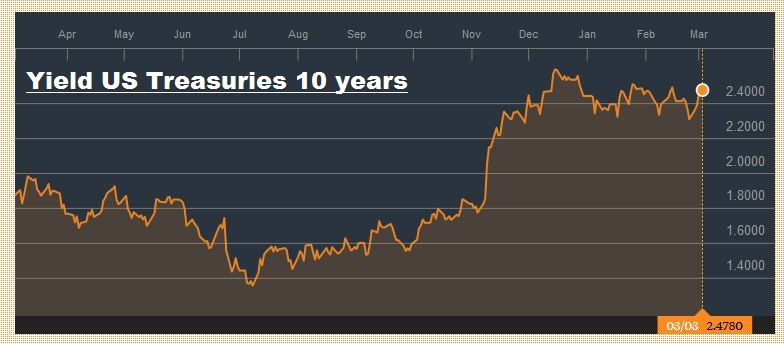 Source: Bloomberg.com - Click to enlarge |
S&P 500 IndexRising bond yields could not derail the historic rally in the equity market. The S&P 500 extended its rally into a sixth week. The key technical development, outside the record highs, was the large gap higher opening following the President Trump’s reiteration of his economic plans for tax reform deregulation and infrastructure investment. The gap drew prices before the weekend, but the fact that the gap was not closed and new |
S&P 500 Index, March 04(see more posts on S&P 500 Index, )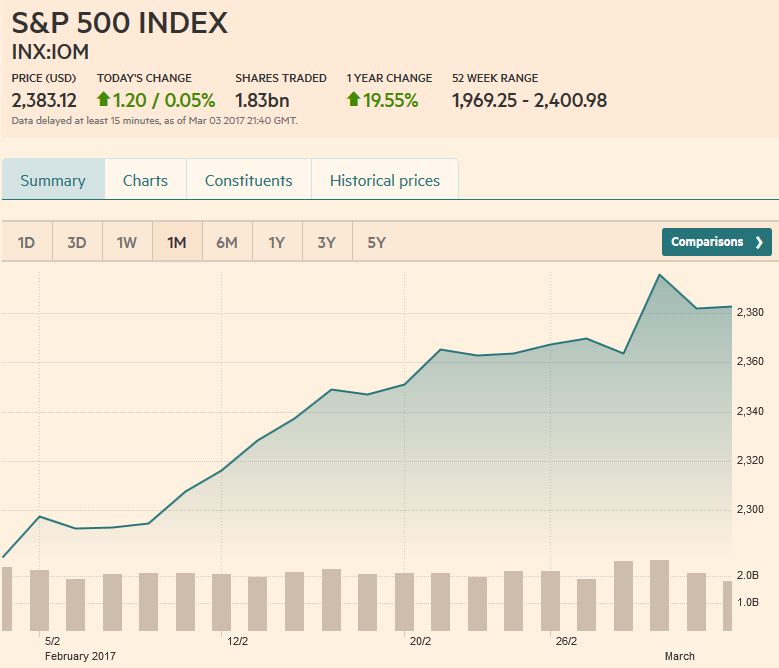 Source: markets.ft.com - Click to enlarge |
Tags: Australian Dollar,Bollinger Bands,British Pound,Canadian Dollar,Crude Oil,Dollar Index,EUR / USD,EUR/CHF,Euro,Euro Dollar,Featured,Japanese yen,MACDs Moving Average,newslettersent,RSI Relative Strength,S&P 500 Index,Stochastics,Swiss Franc Index,U.S. Treasuries,USD/CHF,USD/JPY

