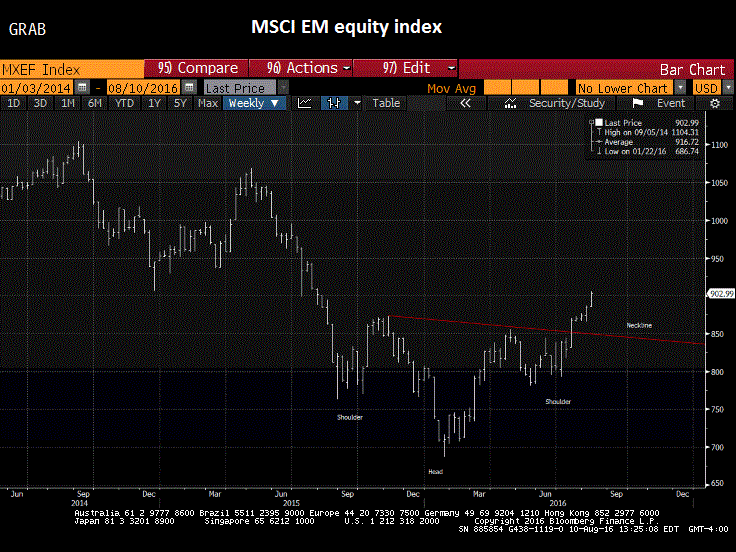
Summary: Liquidity rather than intrinsic value seems to be driving EM assets. MSCI EM equity index looks constructive technically. The chart pattern suggests scope for around 13% gains from here. Scratch an investor, and you will find two models. One is a fair value model, perhaps based on free-cash-flow or earnings expectations, or breakup value. The other is based on liquidity. We suspect that the latter is overwhelming the former in the emerging market equity space. The ECB and BOJ are easing policy aggressively. The BOJ has indicated it will conduct a comprehensive review next month. The only pre-condition BOJ Governor Kuroda has indicated is that the BOJ will not do less. The ECB will have new staff forecasts. It is difficult to see a material change in its expected path for prices. The risk is that the ECB announces another six-month extension in its asset purchase program. It may have to address the shortage of some sovereign issues. Although there is speculation that it eschews the capital key (A decision-making rule to determine which bonds to buy. The capital key favors large countries, like Germany and France, over small countries), but we are not convinced it will be dropped.
Topics:
Marc Chandler considers the following as important: Bank of England, Bank of Japan, emerging markets, European Central Bank, Featured, FX Trends, Great Graphic, MSCI EM equity index, newsletter
This could be interesting, too:
Nachrichten Ticker - www.finanzen.ch writes Die Performance der Kryptowährungen in KW 9: Das hat sich bei Bitcoin, Ether & Co. getan
Nachrichten Ticker - www.finanzen.ch writes Wer verbirgt sich hinter der Ethereum-Technologie?
Martin Hartmann writes Eine Analyse nach den Lehren von Milton Friedman
Marc Chandler writes March 2025 Monthly
Summary:
Liquidity rather than intrinsic value seems to be driving EM assets.
MSCI EM equity index looks constructive technically.
The chart pattern suggests scope for around 13% gains from here.
| Scratch an investor, and you will find two models. One is a fair value model, perhaps based on free-cash-flow or earnings expectations, or breakup value. The other is based on liquidity. We suspect that the latter is overwhelming the former in the emerging market equity space.
The ECB and BOJ are easing policy aggressively. The BOJ has indicated it will conduct a comprehensive review next month. The only pre-condition BOJ Governor Kuroda has indicated is that the BOJ will not do less. The ECB will have new staff forecasts. It is difficult to see a material change in its expected path for prices. The risk is that the ECB announces another six-month extension in its asset purchase program. It may have to address the shortage of some sovereign issues. Although there is speculation that it eschews the capital key (A decision-making rule to determine which bonds to buy. The capital key favors large countries, like Germany and France, over small countries), but we are not convinced it will be dropped. Still, any move that allows the ECB to buy more peripheral bonds will likely be understood as another dimension of easing. Recall the meaning of what Japan has dubbed QQE. One “Q” is for quantity, and the other is for quality. The argument was that buying riskier assets (lower quality) that have can have a more direct and powerful impact on prices of risky assets, and there is more aggressive/potent than a QE buying the risk-free asset. The Bank of England rejoined the QE crowd. The apparently relative small float relative has revealed a shortage that is manifest in the significant decline of yields. The Gilt rally has been so powerful that it appears to have pulled down other yields with it. It also will buy corporate bonds (GBP10 bln). It cut interest rates by 25 bp and signaled the likelihood of another small cut, but eschewed negative rates. The Reserve Bank of Australia cut rates last week, and the Reserve Bank of New Zealand is widely anticipated to cut rates Thursday in Wellington. There is speculation that both central banks will cut rates again before the end of the year. Meanwhile, the Fed funds futures do not imply confidence (more than 50% chance) of a rate hike through next year. That brings us back to emerging market equities. With interest rates lower for longer, emerging market equities can be buoyed. The Great Graphic was composed on Bloomberg. It shows a weekly bar chart of the MSCI Emerging Market equity index. From a technical perspective, it appears to have carved out a head and shoulders bottom. The neckline was broken in the middle of July. It has rallied for four weeks through last Friday and is five in the last six weeks. An important thing about chart patterns is the measuring objective on the breakout. The pattern extends from the head (~687) to the neckline (~850). The measuring objective found by flipping the pattern over. It is a roughly 173-point pattern. Add that to the neckline breakout, and the target is roughly 1023. That target is about 13% above prevailing levels. The iShares MSCI Emerging Markets ETF is EEM. |

