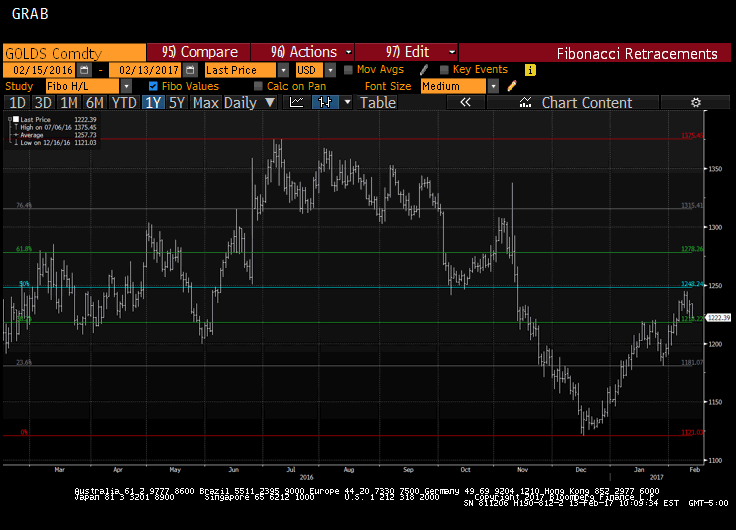
Summary: The Dollar Index is powering ahead, moving higher for the eighth consecutive session. Over the past 100 sessions, gold and the Dollar Index move in the opposite direction more than 90% of the time. The technical condition of gold is deteriorating. The Dollar Index is extending its advancing streak today into its eighth consecutive session. It is at its best level since just before Trump’s inauguration. It has retraced 38.2% of its decline from the January 3 high of 103.82. That retracement was found a little below 101. The 50% retracement objective is a hair above 101.50, while the 61.8% objective is found near 102.07. The five-day average crossed above the 20-day moving average before the weekend for the first time in over a month. Technical indicators such as the RSI, MACDs and Slow Stochastics confirm a constructive technical backdrop. Gold and the Dollar Index tend to move in opposite directions. In fact, over the past 100 sessions, the two have an inverse correlation of -0.93. Although the correlation has softened a little, over the past 60 days, the correlation is about -0.81. Gold, as this Great Graphic created on Bloomberg illustrates, has been moving higher since shortly after the Fed hiked rates in the middle of December.
Topics:
Marc Chandler considers the following as important: Featured, Gold, Gold and its price, Great Graphic, newslettersent, USD
This could be interesting, too:
Nachrichten Ticker - www.finanzen.ch writes Die Performance der Kryptowährungen in KW 9: Das hat sich bei Bitcoin, Ether & Co. getan
Nachrichten Ticker - www.finanzen.ch writes Wer verbirgt sich hinter der Ethereum-Technologie?
Marc Chandler writes March 2025 Monthly
Mark Thornton writes Is Amazon a Union-Busting Leviathan?
Summary:
The Dollar Index is powering ahead, moving higher for the eighth consecutive session.
Over the past 100 sessions, gold and the Dollar Index move in the opposite direction more than 90% of the time.
The technical condition of gold is deteriorating.
| The Dollar Index is extending its advancing streak today into its eighth consecutive session. It is at its best level since just before Trump’s inauguration. It has retraced 38.2% of its decline from the January 3 high of 103.82. That retracement was found a little below 101.
The 50% retracement objective is a hair above 101.50, while the 61.8% objective is found near 102.07. The five-day average crossed above the 20-day moving average before the weekend for the first time in over a month. Technical indicators such as the RSI, MACDs and Slow Stochastics confirm a constructive technical backdrop. Gold and the Dollar Index tend to move in opposite directions. In fact, over the past 100 sessions, the two have an inverse correlation of -0.93. Although the correlation has softened a little, over the past 60 days, the correlation is about -0.81. Gold, as this Great Graphic created on Bloomberg illustrates, has been moving higher since shortly after the Fed hiked rates in the middle of December. Those gains carried the precious metal 10% higher and came within a couple of dollars of a 50% retracement of the decline from last year’s high (recorded in July near $1375.45). That high of almost $1245 also was less 1% from completing the 61.8% retracement of the sell-off since the US election early last November. Gold’s technical tone has weakened. The RSI did not confirm the push to new highs last week, leaving a bearish divergence in its wake. The MACDs are about to cross lower, and the Slow Stochastics are also curling over. A move below the $1214-$1216 area, where the 20- and 200-day moving average converge would be the preliminary signal. The Fibonacci retracements are found near $1197.50, $1182.95, and $1168.35. However, if our assessment is correct, a return to last December’s low near $1121 should not be ruled out. |
Gold Commodity Feb 2016 - 2017 |
Tags: #USD,Featured,Gold,Great Graphic,newslettersent

