The Federal Reserve has become more aggressive again, after several years of acting docile. As you can see on this chart of the Fed’s balance sheet, it has very rapidly expanded from a baseline from (prior to) 2015 through 2018, of about .4 trillion. After which, it had attempted to taper, getting down to .8 trillion last summer. Then it was obliged to reverse itself well before responding to the COVID lockdown. Since then, its balance sheet has gone vertical. Fed Balance Sheet, 2015-2020 - Click to enlarge More is expected to come. So, needless to say, more of what people call inflation—that is, rising prices—is expected to come. Never mind that in 1983, a pair of Levis 501 jeans was (Keith remembers paying that price at that time) and today, the price
Topics:
Keith Weiner considers the following as important: 6a.) Keith Weiner on Monetary Metals, 6a) Gold & Bitcoin, Basic Reports, Debt, demand for money, Featured, Federal Reserve, inflation, net present value, newsletter, perverse incentive
This could be interesting, too:
Nachrichten Ticker - www.finanzen.ch writes Die Performance der Kryptowährungen in KW 9: Das hat sich bei Bitcoin, Ether & Co. getan
Nachrichten Ticker - www.finanzen.ch writes Wer verbirgt sich hinter der Ethereum-Technologie?
Martin Hartmann writes Eine Analyse nach den Lehren von Milton Friedman
Marc Chandler writes March 2025 Monthly
| The Federal Reserve has become more aggressive again, after several years of acting docile. As you can see on this chart of the Fed’s balance sheet, it has very rapidly expanded from a baseline from (prior to) 2015 through 2018, of about $4.4 trillion. After which, it had attempted to taper, getting down to $3.8 trillion last summer. Then it was obliged to reverse itself well before responding to the COVID lockdown. Since then, its balance sheet has gone vertical. |
Fed Balance Sheet, 2015-2020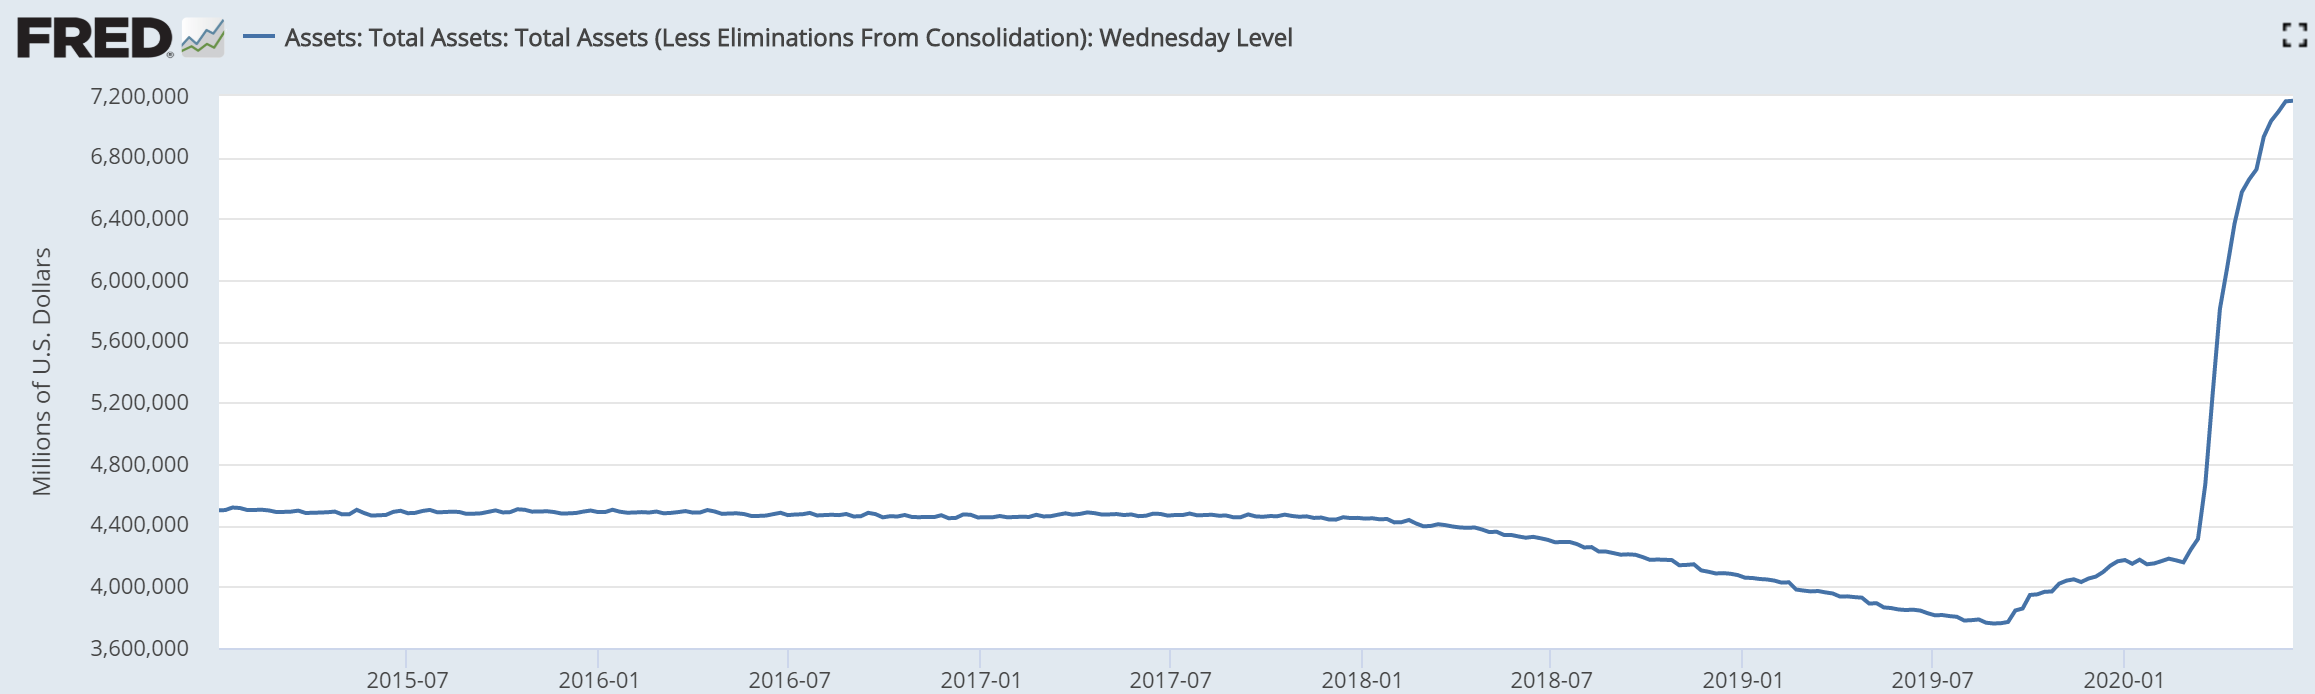 - Click to enlarge |
| More is expected to come. So, needless to say, more of what people call inflation—that is, rising prices—is expected to come. Never mind that in 1983, a pair of Levis 501 jeans was $50 (Keith remembers paying that price at that time) and today, the price is $35.70 at Levis.com. After 37 years of relentless—and increasingly rapid—increase in the quantity of dollars, the price of blue jeans has dropped 25%. Did we mention that crude has had not one, but two crashes in the last 6 years?
As an aside, when critics of the Fed give the impression that the main evil committed by the central bank—if not the only evil—is to cause prices to rise, and then prices do not rise, they give the impression that the Fed is doing alright. It’s not alright, as this chart shows. |
Nonfarm payrolls, 2002-2020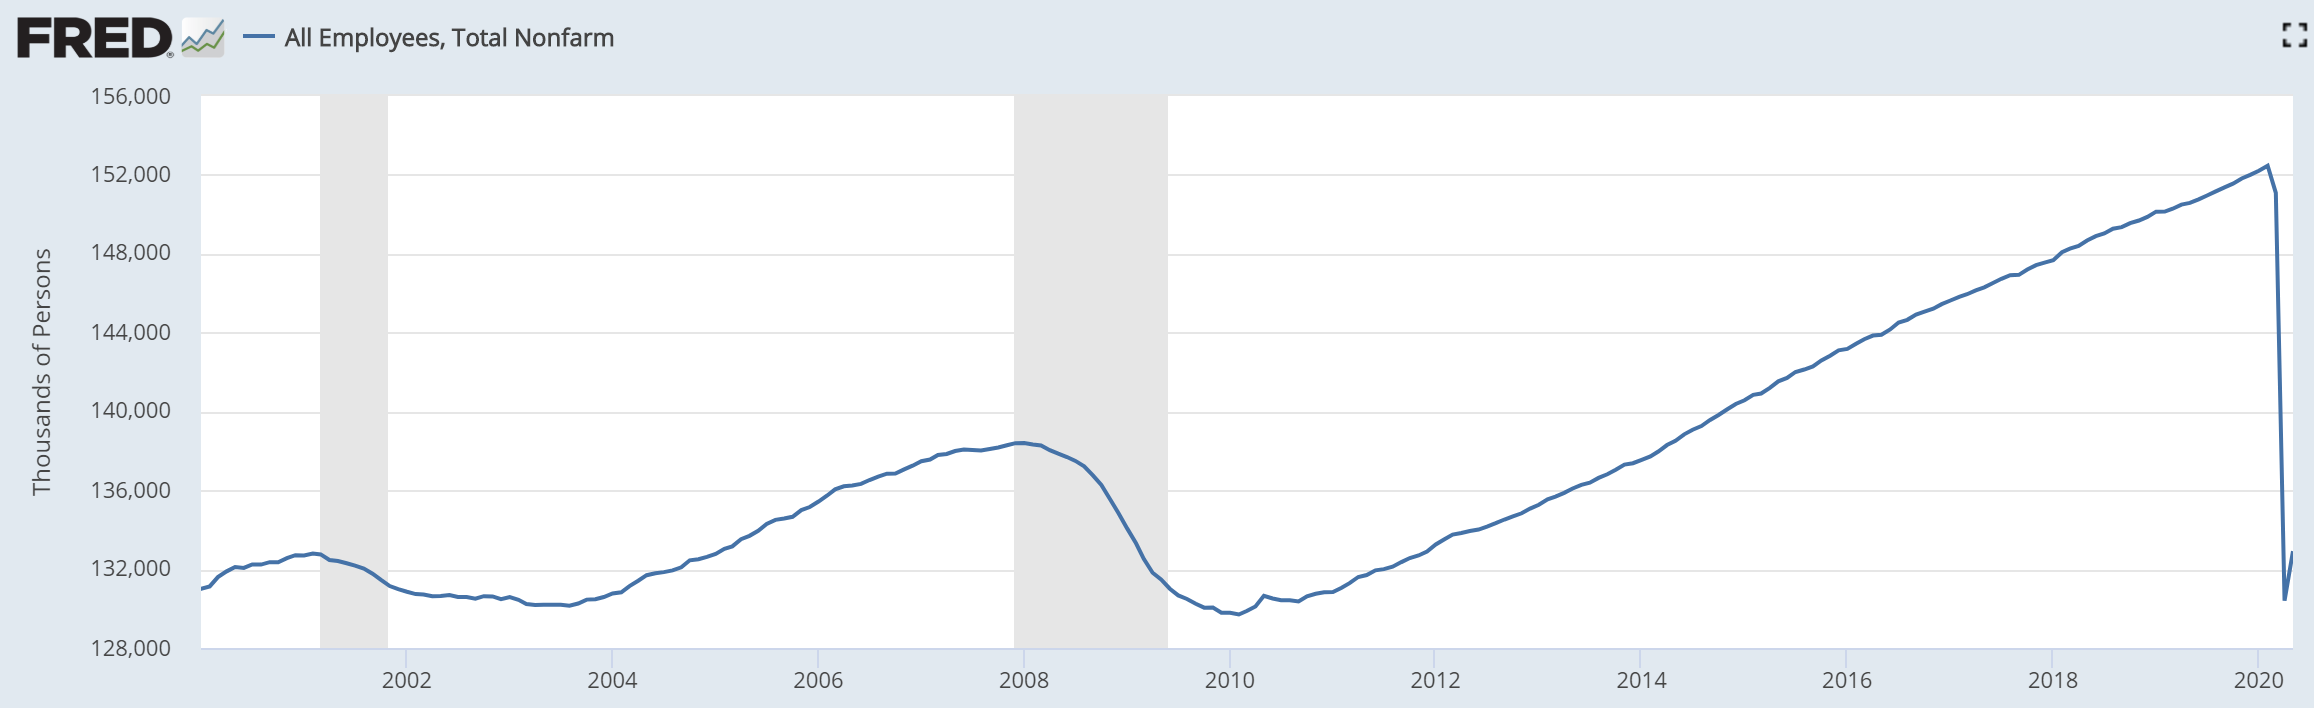 - Click to enlarge |
During the last debt crisis, the economy shed all of the jobs it created since the previous crisis. And now (notwithstanding there’s no grey shading yet, indicating recession) all of the jobs created since both 2009 and 2002 are gone. More will be going, when many business owners run out of money or throw in the towel. And more, when the so called Payroll Protection Plan stops subsidizing jobs for workers who are not producing enough to cover the cost of employing them.
This graph suggests that all the jobs created since 2000 were fueled by the Fed’s falling interest rates. Such jobs would be in capital-consuming industries, and not sustainable. We say this because every such job has evaporated in a time of credit crisis, in 2001, 2008, and 2020 (and we know that cutting the interest rate does juice up GDP, but activity that depends on falling rates is not sustainable.)
So today in 2020, despite a larger population and workers able to work later into their golden years (and forced to, by economic circumstances), the economy is not able to employ more workers than it did in 2000. The Fed (along with other government policies) has caused enormous discoordination. People still want to consume more, and most unemployed people want to work, but government has built a wall keeping these two groups apart.
Speaking of employment, Monetary Metals is creating value and growing—we are hiring a bookkeeper. Please contact us if interested.
It’s All About the Debt
This brings us to today’s topic. The flip side of the dollar is debt. Perhaps because people think of the dollar as money, they picture the Fed printing and skip over a Grand Canyon of faulty assumptions and unwarranted inferences to the idea that people somehow have more money to chase the same goods, and hence bid up prices. So let’s cut through this fallacy.
When the Fed creates more dollars, none of them appear in your pocket.
They do not get into the pocket of your neighbor, either. No, not even the rich guy down the street who is always driving a new Ferrari. That is not how it works.
The Fed does not gift free money to the people. It does not drop bags of cash from helicopters, notwithstanding disingenuous comments by a former Fed Chairman. It does not even give free cash to the big banks.
The Fed buys assets from them. Historically it bought Treasury bonds, but now its appetite has expanded to include mortgage bonds, corporate bonds, and municipal bonds.
To help clarify our point, let’s go through the mechanics of this. Step one, a commercial bank borrows $1 million. Step two, the bank buys a bond. That is, it gives up $1 million in cash, and gets a $1 million bond in exchange. Step three, the Fed borrows $1 million. Step four, it buys the bond. That is, it gives up $1 million in cash to the commercial bank, and gets the $1 million bond in exchange.
The act of borrowing and the act of buying are combined in one step with the Fed. It’s simple but it’s so hard to see, because people think of the dollar as money. However, the dollar is actually the Fed’s liability. When a bank sells a bond to the Fed, it prefers the Fed’s liability to the bond. If the bond is a Treasury bond, then why would the bank prefer the Fed’s credit to the Treasury’s credit?
There is not so much difference between the two. Both are government credit. The Treasury pays interest (barely) and has a maturity that is a date in the future. By law, the Fed’s credit is a current asset, that is, zero maturity. And it may be used to pay all debts.
To sell a bond is to exchange one credit paper for another.
This act does not provide free value to either party (though the Fed generally buys on an uptick in price, which is a downtick in interest rates, so there is a little capital gain). No one finds money that just appeared in his pocket. Hordes of people are not dollared-up, running out to stores to throw more dollars after the same goods.
This picture, evoked by the Quantity Theory of Money, is not a picture of reality the way Hogwarts is not a picture of a real school.
It’s hard to wrap your head around the idea that the Fed borrows from everyone who demands what they think is money. The Fed does not print out of thin air, it borrows from everyone. People willingly—happily—lend to the Fed. Because they think they are getting money!
Carl Sagan expressed it succinctly:
“One of the saddest lessons of history is this: If we’ve been bamboozled long enough, we tend to reject any evidence of the bamboozle.”
The Argument for the Rising Demand for Cash
Many economists would respond to the above, and say, “well, prices wouldn’t rise if demand for money increased along with the quantity.” There is a grain of truth to this.
The desire (or need) to hold a cash balance is rising. This is not due primarily to the rise in quantity of dollars. Nor to Keynes’ so called animal spirts. It is due to two facts. It is the rising quantity of debt times the rising net present value of each dollar of debt.
Suppose you own a small print shop, free and clear. No debt. How much cash do you need to hold? Perhaps two or three months of expenses, would be a guess.
And suppose your competitor across the street has an identical shop, but owes $1 million. How much cash does he need to have? Before answering that, suppose it is short-term debt. He is obliged to roll it over every six months. He incurs the risk that when he needs to refinance a note, the market may not be willing. Therefore, we can be certain that he needs a lot more cash than you do.
Now consider a bank. When the average interest rate earned by the bank is 8%, and the bank is paying 4%, it earns a net spread of 4%. If the bank has $1 billion in assets, it is earning $40 million a year. But the interest rate falls and falls and falls. Today, a bank is paying close to 0% to savers but it is lucky if it can earn 1%. The same billion dollars in assets earns less than $10 million. So in order for the bank to make the same $40 million a year, it has to lever up. It needs over $4 billion in assets, compared to the $1 billion it needed previously.
This is why its baseline need for cash is probably four times higher. But what about when there are problems in the land of credit? Today, we know that many residential and commercial property owners are not paying their mortgages. While businesses are trying to draw down credit facilities, there are many who are in default. Banks need more liquidity. More cash.
So they exchange their bonds for cash. Not to spend the cash bidding up the price of everything from avocadoes to Zoom video calls. But to meet their obligations, and avoid being forced into bankruptcy.
The Math of Rising Demand for Cash
As the interest rate falls, everyone has both means and motive to borrow more. The means is that the monthly payment is lower. The motive is as we saw with the bank. When the rate of return drops, you need more assets to generate the same profit. You must borrow more to build or buy more assets.
So debt rises.
At the same time, the net present value of each dollar of debt also rises. All future payments on the debt must be discounted to calculate the present value. They are discounted at the market interest rate. So when the rate fell from 8% to 4%, the NPV of all extant debt doubled. And from 4% to 2%, another double. And so on.
This reflects the falling profit margin as more businesses borrow to add more capacity. They have to work harder and harder for the same net dollar of income. Older readers will remember restaurants before 2007, on Thursday through Sunday nights they handed out pagers and would page you when your table was ready. We don’t refer only to trendy midtown Manhattan or West End eateries. This was any decent restaurant even in suburbia. Today (even before the virus), most restaurants are not filling all the tables even on Friday nights.
Carmakers (even before the virus) were advertising 0% for 72 months (even when the Fed thought it should try hiking rates).
It is twice as hard to earn a dollar of free cash flow to pay down a debt, when the prevailing rate is 4%, compared to when it is 8%.
Unusual Behavior in the Silver Market
In our thoughtful disagreement with Ted Butler, we proved that there is no large-scale selling of futures to suppress the price. Our proof was that the basis falls as each futures contract heads into expiration. If the manipulators had a large futures position to suppress the price—a short position—then they would have to close their contracts before contract expiry.
To close a short futures contract position, you buy that contract.
Remember, these manipulators would have to buy with urgency, as the conspiracy theory says they have not got the metal to deliver. And keep in mind that this buying would be massive. A short position large enough to keep the price down would have to be bought back in a short period of time. It would push up the price of the expiring contract, relative to the price of physical metal (and farther-out futures).
Basis = future – spot
If the conspiracy theory were true, then the basis would rise as each contract headed into expiry. But we showed the data for every silver contract since 1996 (and every gold contract here). The basis of every one of them goes down as they approach expiry. This means that short-sellers are arbitragers, buying spot and selling future. And it is the long positions that must be closed before expiry (because most longs do not have the cash to pay for the metal and take delivery).
| Incidentally, although Mr. Butler asked for thoughtful disagreement and said he was looking to check his premises, he did not respond to our argument and data.
The March contract this year behaved normally (at least what passes for normal in our abnormal zero-interest world). The basis ends up around -2% by mid-February. |
Silver Basis and Co-basis and the Dollar Price, November 2019-February 2020(see more posts on dollar price, silver basis, Silver co-basis, )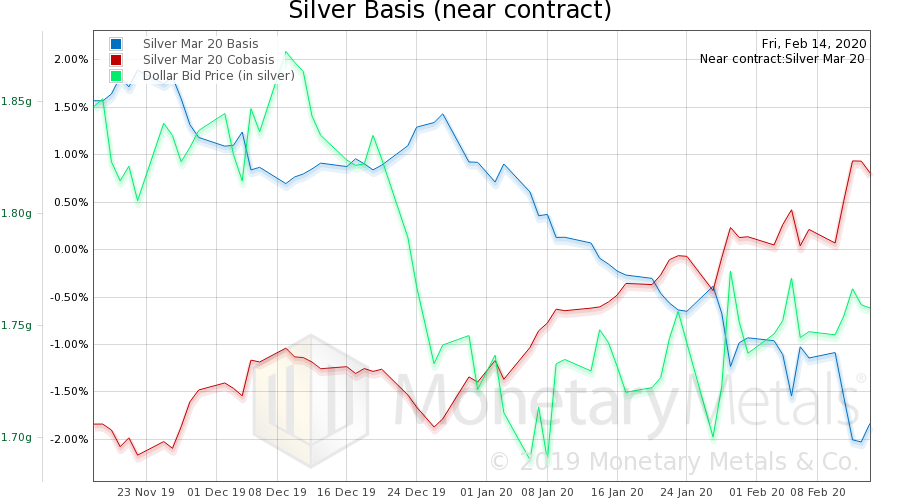 The basis ends up around -2% by mid-February. - Click to enlarge |
| But here is the July contract. |
Silver Basis and Co-basis and the Dollar Price, March 2020-June 2020(see more posts on dollar price, silver basis, Silver co-basis, )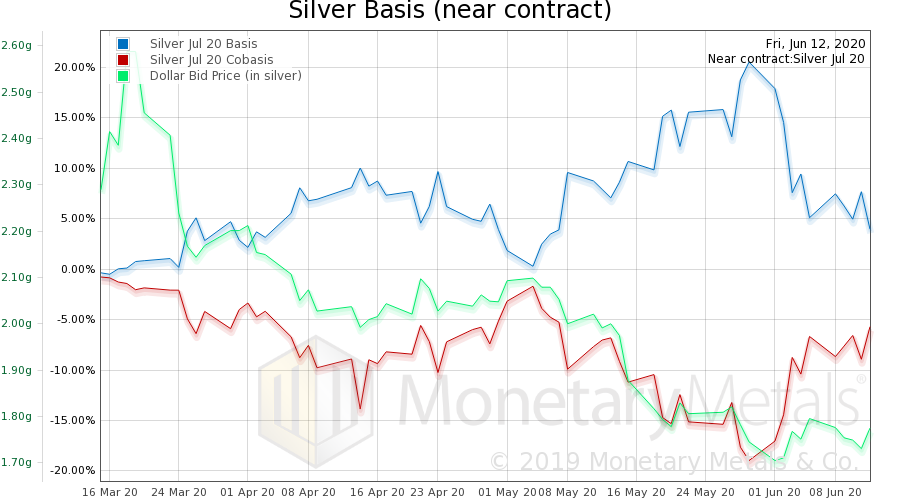 - Click to enlarge |
| Note something odd. Until June 1, the basis was rising. Then it fell. And now look at the May contract.
The basis rises all the way up to a few weeks before expiry, ultimately hitting over 20% (annualized). If you look at the chart in the Butler response article, you see there is no historical precedent for this (at least in the last 24 years). |
Silver Basis and Co-basis and the Dollar Price, January 2020-April 2020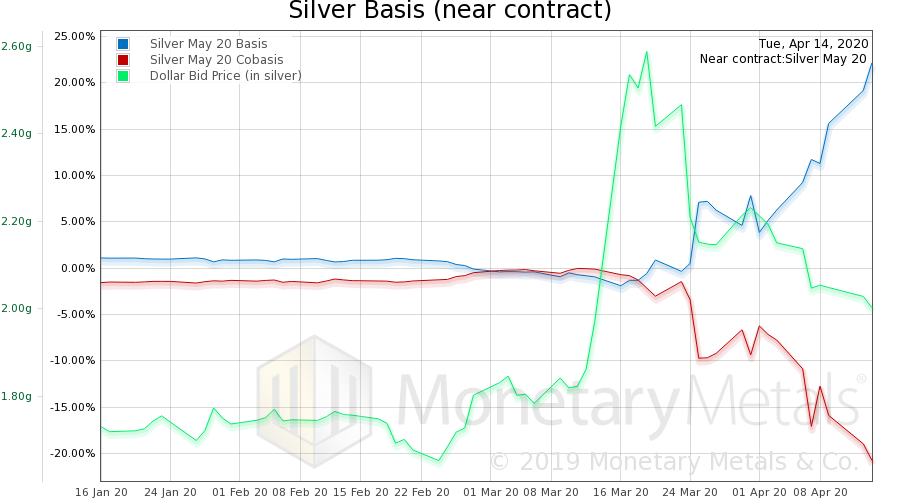 - Click to enlarge |
Does this mean that there was a silver manipulation cartel who had to begin unloading a massive silver short position around mid-March, and which cleared out by the end of May? Obviously not, as this was a period when the silver price rose from about $12 to about $18.
We think the rising basis heading into expiry signifies the absence of the arbitragers. When speculators bought metal to bet on the rising price, there was no market maker to sell short a new contract and arbitrage the widening spread to spot silver.
And if we look at the simple fact of the basis being 22%, there is no reason why it should get to even a quarter of that level, in a world where the 10-year government bond—deemed risk-free—was paying 0.5%. Except if the would-be arbitragers were absent.
Now, the market is slowly returning to normal, as the July contract shows. The basis is down to under 4%. If the market offers a risk-free profit, someone will take it.
Gold had a rising basis through April 13, but it was not as extreme as in silver, nor as long-lived. The gold basis is now 2.4%, which is still elevated but not so remarkable.
One last thing needs to be said about the high silver basis. If you want the price to rise, you should want a low basis. Why?
The basis is the cost of carry, to those who prefer to hold their metal position in the futures market. The higher this cost, the stronger the disincentive to hold the position. For market participants who cannot or will not stack coins—hedge funds, family offices, etc.—they may have to close their silver positions (of course, we believe they should invest their metal Monetary Metals, which not only avoids the cost of carry but pays interest).
© 2020 Monetary Metals
You Might Also Like
 Open Letter to John Taft, Report 17 Dec
Dear Mr. Taft: I eagerly read your piece Warriors for Opportunity on Wednesday, as I often do about pieces that argue that capitalism is not working today. You begin by saying: “Financial capitalism – free markets powered by a robust financial system – is the dominant economic model in the world today. Yet many who have benefited from the system agree it’s not working the way it ought to.”
 The Out Has Not Yet Begun to Fall, Market Report 31 March
So, the stock market has dropped. Every government in the world has responded to the coronavirus with drastic, if not unprecedented, violations of the rights of the people. Not to mention, extremely aggressive monetary policy. And, they are about to unleash massive fiscal stimulus as well (for example, the United States government is about to dole out over $2 trillion worth of loot).
 Everyone Knows The Gov’t Wants A ‘Controlled’ Weimar
There are two parts behind the inflation mongering. The first, noted yesterday, is the Fed’s balance sheet, particularly its supposedly monetary remainder called bank reserves. The central bank is busy doing something, a whole bunch of something, therefore how can it possibly turn out to be anything other than inflationary?The answer: the Federal Reserve is not a central bank, not really.
 FX Daily, June 9: Profit-Taking Gives Turn Around Tuesday Its Name
Overview: The S&P 500 turning higher on the year was the last straw before an arguably overdue bout of profit-taking kicked-in and is the dominant feature today in the capital markets. It began slowly in the Asia Pacific region. Equities were mixed, and Australia’s 2.4% rally and the 1.6% gain in Hong Kong stood out. Europe’s Dow Jones Stoxx 600 was off for a second day (~1.3%), and US stocks are trading heavily, warning that the S&P 500 may give back most of yesterday’s gains.
 FX Daily, June 10: Corrective Forces Still Seem in Control Ahead of the FOMC Outcome
The pullback ins US shares yesterday has not derailed the global advance. Japanese and Chinese markets were mixed, the Hang Seng slipped, and Indonesia was hit with profit-taking, but the MSCI Asia Pacific Index eked out a small gain. It has fallen once past two and a half weeks. The Dow Jones Stoxx 600 opened higher but is falling for the third consecutive session.
 Why The FOMC Just Embraced The Stock Bubble (and anything else remotely sounding inflationary)
The job, as Jay Powell currently sees it, means building up the S&P 500 as sky high as it can go. The FOMC used to pay lip service to valuations, but now everything is different. He’ll signal to all those fund managers by QE raising bank reserves, leading them on in what they all want to believe is “money printing” (that isn’t).
 FX Daily, June 11: Are Risk Appetites Satiated, or Simply Taking the Day Off?
Many observers are attributing the sell-off in risk assets today to the Federal Reserve’s pessimistic outlook, yet, as we note below, the Fed’s median GDP forecast this year is better than many international agency forecasts, including the OECD’s that was issued yesterday. Moreover, some near-term trends were already in place.
 FX Daily, June 16: Correction Scenario Tested
Overview: Shortly after the US stock market opened sharply lower, the Federal Reserve announced that it’s Main Street facility was up and running. US stocks never looked back. After the S&P 500 recouped its full decline, the Fed announced it would begin buying corporate bonds. Up until now, it had been buying representative ETFs. Stocks rallied further on the news before pulling back into the close. The rally in risk assets carried into Asia.
Tags: Basic Reports,debt,demand for money,Featured,federal-reserve,inflation,net present value,newsletter,perverse incentive