The BLS’s payroll report draws most of the mainstream attention, with the exception of the unemployment rate (especially these days). The government designates the former as the Current Employment Statistics (CES) series, and it intends to measure factors like payrolls (obviously), wages, and earnings from the perspective of the employers, or establishments. The Establishment Survey. Its cousin is called the Household Survey, or CPS, the Current Population Survey, which comes at everything from the other side. Here the government asks a large panel of households about how many might be eligible to work, who in them is looking for work or has already found it, and for how many hours that might have been. The CPS informs the BLS about the size of the labor force and
Topics:
Jeffrey P. Snider considers the following as important: 5.) Alhambra Investments, bonds, currencies, current employment statistics, current population survey, economy, establishment survey, Featured, Federal Reserve/Monetary Policy, household survey, labor force, Labor market, Markets, newsletter, payrolls, total hours worked, unemployment rate
This could be interesting, too:
Nachrichten Ticker - www.finanzen.ch writes Die Performance der Kryptowährungen in KW 9: Das hat sich bei Bitcoin, Ether & Co. getan
Nachrichten Ticker - www.finanzen.ch writes Wer verbirgt sich hinter der Ethereum-Technologie?
Martin Hartmann writes Eine Analyse nach den Lehren von Milton Friedman
Marc Chandler writes March 2025 Monthly
The BLS’s payroll report draws most of the mainstream attention, with the exception of the unemployment rate (especially these days). The government designates the former as the Current Employment Statistics (CES) series, and it intends to measure factors like payrolls (obviously), wages, and earnings from the perspective of the employers, or establishments. The Establishment Survey.
Its cousin is called the Household Survey, or CPS, the Current Population Survey, which comes at everything from the other side. Here the government asks a large panel of households about how many might be eligible to work, who in them is looking for work or has already found it, and for how many hours that might have been.
The CPS informs the BLS about the size of the labor force and how many in this broad group say they’re employed, leaving for the BLS some easy math to come up with the unemployment rate. The issue is not the math.
Unlike the CES, however, the CPS is not heavily sedated in statistical terms; the Establishment Survey is hugely smoothed and on purpose. For quite legitimate reasons, the BLS tries very hard to make monthly data apples to apples when monthly data drawn from a truly messy jobs market just doesn’t want to stick to a single fruit type.
Choosing not to smooth the monthly figures, well that’s the Household Survey. From it you can see why the BLS at least wants to make its star attraction so much less noisy. Month to month, the various employment factors contained within it can be all over the place at times; rising one month by a considerable amount before outright falling the next.
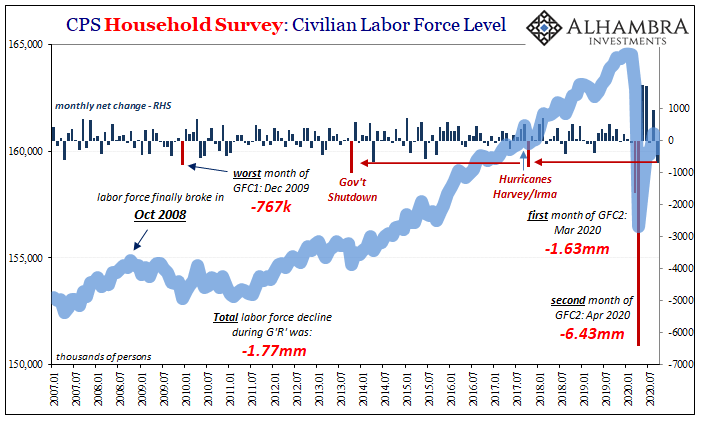
But there are limits to bounciness, and even when factoring this statistical noise tendency we have to take note when those limits might get violated. Take, for example, the Labor Force data. As we’ve noted before, the last decade or so the labor market itself has tread new ground; before October 2008, no recession had produced a sustained decline in the labor force itself.
GFC1 (sorry R*) broke the labor market in a way the economy hadn’t experienced since the thirties. The result so far as the CPS data has been concerned is more frequent negatives. Like money dealers in the broken eurodollar system, it seems as if marginal American workers also become skittish at the first sign of trouble, and in their case end up telling the BLS they are no longer workers when it gets dicey; right out of the labor force they go.
One of those times was October 2017. You might remember that month not just because of Xi Jinping and what China’s 19th Communist Party Congress did to Japanese banks redistributing swapped eurodollar resources into that particular country. Weeks before that particular month had ever begun, the US South had been struck by a pair of very powerful hurricanes; Harvey which smacked Houston square on; and Irma which beleaguered Florida’s Gulf coast before moving further north and inland.
With so much weather-related disruption affecting a sizable chunk of the population therefore economy, the BLS at first estimated (CES) that in September 2017 the number of payrolls had shrunk for the first time since 2010; breaking a very long (and ultimately meaningless) streak. That negative has been revised to a slight positive in the meantime, but the low number remains, therefore indicating how September 2017 wasn’t a good month in the labor market.
This was reflected in October 2017 by a huge decline in the Labor Force number; around 830 thousand in just that single month. While we expect any CPS component to be noisy, that much especially negative indicated something outside of just noise; in this case, the weather.
| Before that, October 2013. Though it’s been seven years now, this other October was noteworthy for the same thing if different reasons. The Labor Force also dropped by a big number, just over 1 million, though this time it belonged to the politicians in Washington; federal government shutdown.
The other one in the same league which preceded both was a December, 2009 to be specific. In this instance, no one has been blamed instead subprime mortgages or something. What should’ve been laid at the doorstep of Ben Bernanke for that month’s -767 thousand in the Labor Force has never been properly tied to the Fed’s failure to respond to what had been a global dollar shortage. Keynes has been proved right right here in America when he pointed out deflationary pressures absolutely wreck employment. We might more often find minuses, but you just don’t see these big minuses in the Labor Force without some big reason for it. And that would be doubly true for a month like September 2020 when, at least, everything is some gigantic positive. Reopening and whatnot, huge forward momentum carrying even a set of noisy accounts like those in the CPS. How, then, are we supposed to reconcile that with the Labor Force dropping by a whopping 695 thousand last month? That much minus is outside of noise. |
CPS Household Survey: Civilian Labor Force Level, 2007-2020 |
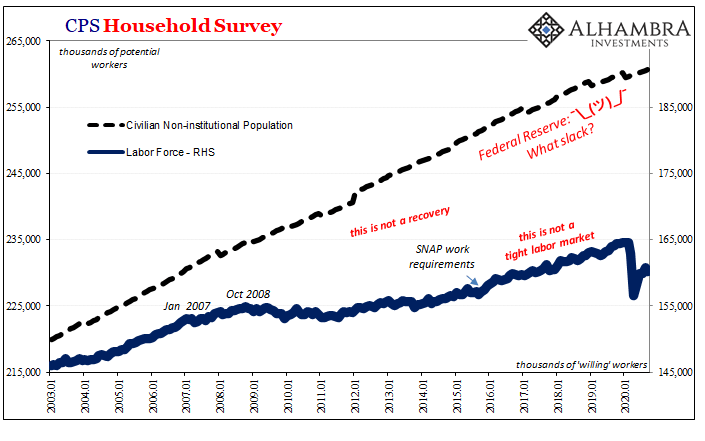
CPS Household Survey, 2003-2020 |
|
| Right? It just doesn’t smell right.
It does only when considering weekly (initial) jobless claims are still above 800 thousand each and every week; substantially higher than every week before March. And this problem is made all the worse, once again, because the unemployment rate falls due to so many fewer telling the BLS’s CPS they’re even bothering to look for work – which means many drop out of its numerator (the number of unemployed; if you’re no longer looking for work even if you don’t have a job you aren’t considered unemployed) as well as its denominator (you can’t be unemployed if you aren’t considered part of the labor force). |
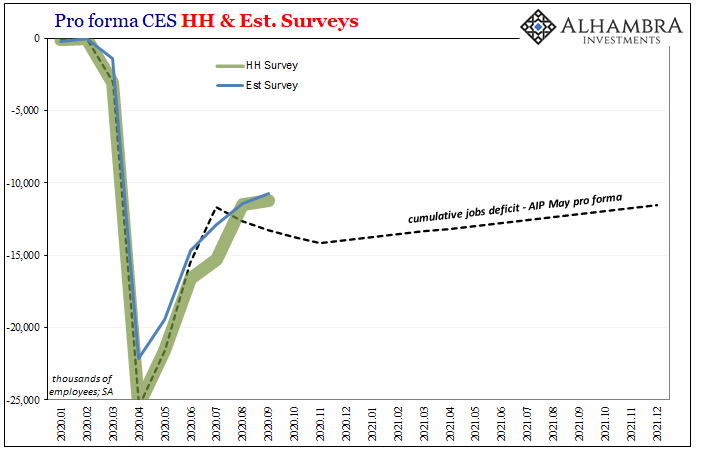
Pro forma CES HH Survey, 2020-2021 |
| The BLS reports for September, both CES and CPS, outside of the unemployment rate should be throwing up alarms all over the place. The Establishment Survey gained 661 thousand for the month, another gigantic positive, but they are becoming noticeably less gigantic by the month. The Household number was just +275 thousand. |
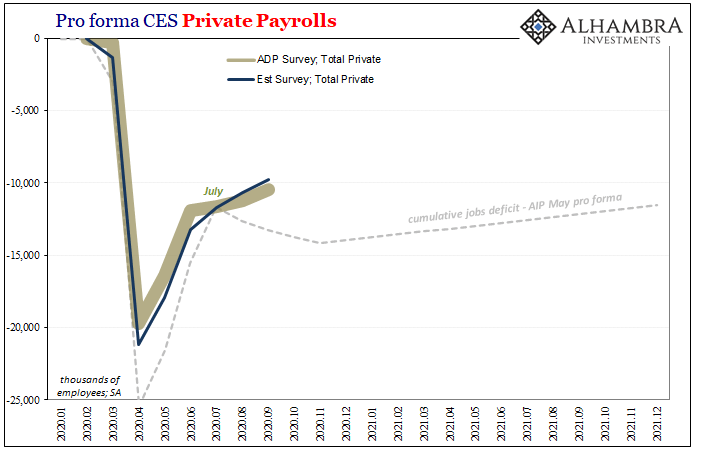
Pro forma CES Private Payrolls, 2020-2021 |
| Still about 11 million jobs in the hole, huge hole, both surveys, this is no time for the labor market to be slowing down like it sure seems to be. The sharp labor force decline backs up the idea with its view from inside the generally perceived true employment situation.
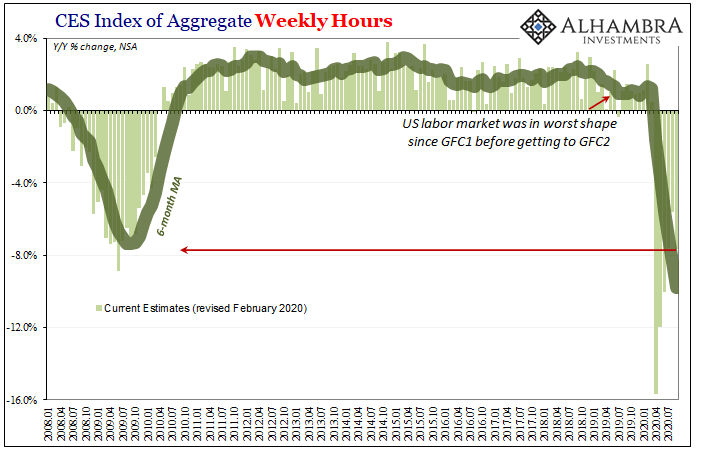
More concerning still, back to the CPS, as we’ve flagged all along its total hours. For the month of September 2020, the BLS index for total labor hours worked was an astounding 7.6% less than the index value for hours worked during September 2019. Not only was that a substantially larger decline than August, this far into reopening and that much negative puts this current labor market on pace with the very worst months of the Great “Recession”; September’s figure would’ve been the second worst had it shown up during 2008-09. Another key data point in the CPS which looks the opposite from the CPS’s unemployment rate because the unemployment just wasn’t meant for this post-2007 economy. |
CES Index of Aggregate Weekly Hours, 2008-2020 |
That little hours available would, however, be quite consistent with the Labor Force decline of this reported size.
Forget the Presidential election. Sure, there’s enough there to keep anyone worried and concerned. But as uncertain as that all may be, it’s much more where it matters much more. This economy sure looks like it took a turn around July, slowing down nowhere near the finish line.
I believe that’s a function of a couple things: 1. The economy was in rough shape to begin this thing, just look hours above; 2. GFC2 immediately put every business in it on the liquidity defensive. Recoveries require risk-taking, which is why Keynes and all his followers have spent volumes studying and coming up with (ineffective) ways to reignite “animal spirits.”
Trump nor Biden, what would make anyone take risks on more labor in September now October 2020? Is it all the QE, the sixth time the Fed’s done it? People say I’m too negative, but neither of these surveys suggest I’m near an extreme. That’s the Labor Force.
Tags: Bonds,currencies,current employment statistics,current population survey,economy,establishment survey,Featured,Federal Reserve/Monetary Policy,household survey,labor force,Labor Market,Markets,newsletter,payrolls,total hours worked,unemployment rate

