Today we are taking our weekly look at the charts for gold and silver. Republicans and Democrats continue to play the “will they, won’t they?” game over another stimulus package in a Covid19 ravaged US economy. An agreement on a package will ultimately be seen as positive for the markets but, with the US Election just weeks away this may prove to prolong negotiations or postpone decisions until the results of the election are clear and accepted by all. Will Gold Now Retest ,930? As you can see from the gold chart below, gold has rallied on positive stimulus news and pulled back as negotiations stall. After the previous “false break” above ,910, gold once again closed above this level which opens up a retest of ,930. However, the short-term upward trend line
Topics:
Mark O'Byrne considers the following as important: 6a.) GoldCore, 6a) Gold & Bitcoin, Daily Market Update, Featured, gold chart, gold price chart, newsletter, silver chart, silver price chart
This could be interesting, too:
Nachrichten Ticker - www.finanzen.ch writes Die Performance der Kryptowährungen in KW 9: Das hat sich bei Bitcoin, Ether & Co. getan
Nachrichten Ticker - www.finanzen.ch writes Wer verbirgt sich hinter der Ethereum-Technologie?
Martin Hartmann writes Eine Analyse nach den Lehren von Milton Friedman
Marc Chandler writes March 2025 Monthly
Today we are taking our weekly look at the charts for gold and silver.
Republicans and Democrats continue to play the “will they, won’t they?” game over another stimulus package in a Covid19 ravaged US economy. An agreement on a package will ultimately be seen as positive for the markets but, with the US Election just weeks away this may prove to prolong negotiations or postpone decisions until the results of the election are clear and accepted by all.
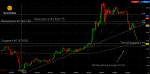
Will Gold Now Retest $1,930?As you can see from the gold chart below, gold has rallied on positive stimulus news and pulled back as negotiations stall. After the previous “false break” above $1,910, gold once again closed above this level which opens up a retest of $1,930. However, the short-term upward trend line is providing support but is also helping to form what most chartists recognise as a bearish pattern. A break of this support trend line opens up a retest of the $1,860 level and a break of that level would be short-term bearish for gold as there is not much in the way of support until $1,810. |
Gold Price Chart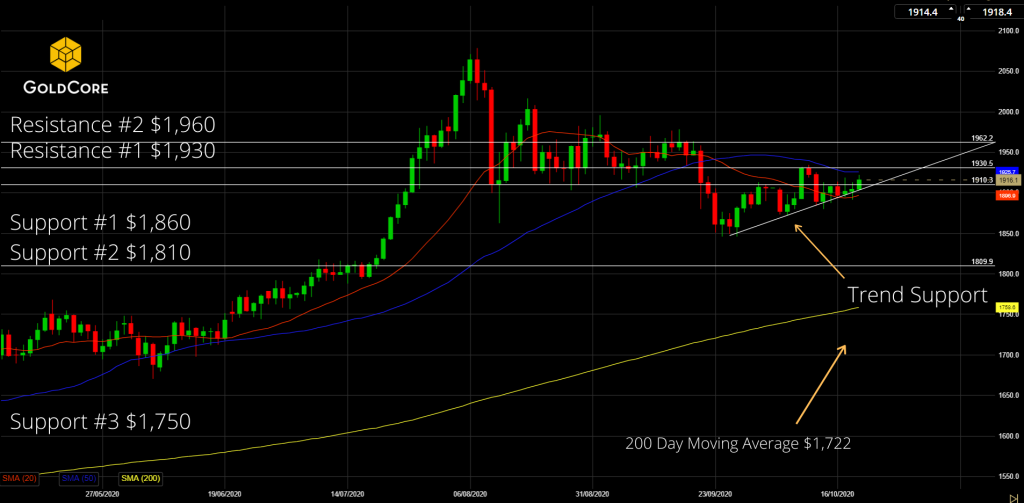 - Click to enlarge |
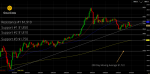
Silver Remains Vulnerable to a Negative News CycleA similar pattern is emerging for silver as it retest $25.20. A close above this level could be short-term bullish for silver and see a quick move up to test the $26.50 level again. With this bearish pattern being formed with the upward sloping trend support line, silver remains vulnerable to a negative news cycle. A break lower opens up a retracement to the support level at $22.60. As we have noted before if we break this level there is not much support on the charts until near the 200 Day Moving Average at $19.50. Clarity on the US Stimulus package will help signal the next move in the precious metals markets. However, this now may not happen until we get clarity on the result of the US election. When the cork is popped we expect this to be very bullish for both gold and silver. Now might be a great opportunity to position your portfolio to take advantage of the upcoming moves. |
Silver Price Chart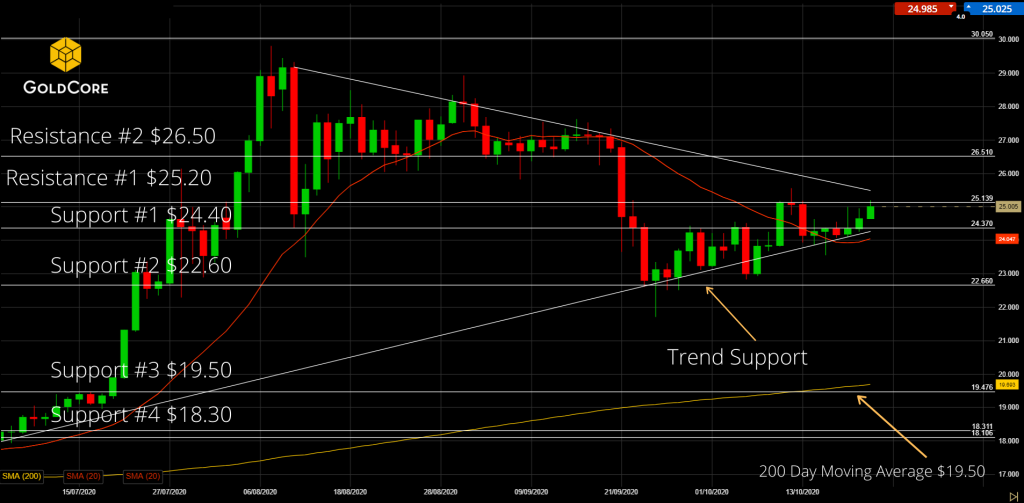 - Click to enlarge |
You Might Also Like
Source: Finiz.com
◆ Gold is the top performing asset in the world in the first half of 2020, outperforming all stock markets including the S&P 500 and the Nasdaq and outperforming “safe haven” U.S. government bonds (see table above).Gold had an 18% gain in dollars in the first half of 2020 as risk assets, especially stock markets, fell sharply with the S&P down 4.5% and other stock markets down more than 10% (see table). Gold gained 18.6% in euros and by 25% in British pounds as the UK economy had the worst contraction since 1979 and the pound was further devalued.
The historical data in the last 20 to 40 years shows that seasonally gold and silver tend to do poorly in June and very well in the summer months in July and August and extending into September. Indeed late June
 Gold Will “Trend Toward $10,000 Per Ounce Or Higher” Over The Next Four Years
You’re likely aware of the price action in gold lately. Gold has rallied from $1,591 per ounce on April 1 to $1,782 per ounce as of today. That’s a 12% gain in less than three months.
 ‘Death Cross’ Strikes U.S. Dollar As Virus Cases Grow
A resurgent coronavirus pandemic in the United States and the prospect of improving growth abroad are souring some investors on the dollar, threatening a years-long rally in the currency.
 Gold Protects from Financial Crisis and Crashes Throughout History – Lucey and O’Connor
This is an interesting interview between Professor Brian Lucey and Dr. Fergal O’Connor, lecturer in finance and economics at University College Cork (UCC) on gold’s performance as a safe haven asset in the last 200 hundred years and in recent history including the 2008-2012 global financial crisis.
 Perfect Storm for Precious Metals Leads to Price Correction
Gold fell by nearly 6% yesterday and silver by a whopping 15%, the largest one day loss in over 7 years. The futures market saw massive volumes of selling with over 1.6 bn ounces of silver contracts sold yesterday. That’s a value of over $40 billion.
 Gold, Silver Jump After Swings Amid Weak Dollar and Economic Woe
Spot gold headed for back-to-back gains as investors weighed the outlook for the metal’s record-setting rally after this week’s dramatic price swings. Silver climbed the most in more than five years.
 Where Next for Gold & Silver
Markets have struggled to find a clear direction as they attempt to digest US election news, debate performance, the impact of increased Covid-19 restrictions in many countries and vaccine news.
 Gold and Silver Set for a Breakout?
Today we are taking our weekly look at the charts for gold and silver. Corvid 19, the US Election and US Financial Stimulus talks have given gold plenty to digest over the last week. On a short term basis gold has been taking a lot of signal from the fortunes of the stock markets and increased hopes of agreement of a financial stimulus package gave a boost to both stock markets and the gold price.
Tags: Daily Market Update,Featured,gold chart,gold price chart,newsletter,silver chart,silver price chart