In November, money supply growth rate was essentially unchanged from October and remains near September’s all-time high. The stabilization we find in money-supply growth in recent months comes after eight months of record-breaking growth in the US which came in the wake of unprecedented quantitative easing, central bank asset purchases, and various stimulus packages. Historically, the growth rate has never been higher than what we’ve seen this year, with the 1970s being the only period that comes close. It was expected that money supply growth would surge in recent months. This usually happens in the wake of the early months of a recession or financial crisis. But it appears that now the United States is several months into an extended economic crisis, with around
Topics:
Ryan McMaken considers the following as important: 6b) Mises.org, Featured, newsletter
This could be interesting, too:
Nachrichten Ticker - www.finanzen.ch writes Die Performance der Kryptowährungen in KW 9: Das hat sich bei Bitcoin, Ether & Co. getan
Nachrichten Ticker - www.finanzen.ch writes Wer verbirgt sich hinter der Ethereum-Technologie?
Martin Hartmann writes Eine Analyse nach den Lehren von Milton Friedman
Marc Chandler writes March 2025 Monthly
In November, money supply growth rate was essentially unchanged from October and remains near September’s all-time high. The stabilization we find in money-supply growth in recent months comes after eight months of record-breaking growth in the US which came in the wake of unprecedented quantitative easing, central bank asset purchases, and various stimulus packages.
Historically, the growth rate has never been higher than what we’ve seen this year, with the 1970s being the only period that comes close. It was expected that money supply growth would surge in recent months. This usually happens in the wake of the early months of a recession or financial crisis. But it appears that now the United States is several months into an extended economic crisis, with around 1 million new jobless claims each week from March until mid-September. More than 5 million unemployed workers are currently collecting standard unemployment benefits, with 8 million more collecting “Pandemic Emergency Unemployment Compensation” as of late November.
| The central bank continues to engage in a wide variety of unprecedented efforts to “stimulate” the economy and provide income to unemployed workers and to provide liquidity to financial institutions. Moreover, as government revenues have fallen considerably, Congress has turned to unprecedented amounts of borrowing. But in order to keep interest rates low, the Fed has been buying up trillions of dollars in assets—including government debt. This has fueled new money creation.
During November 2020, year-over-year (YOY) growth in the money supply was at 37.08 percent. That’s unchanged from October’s rate, and up from November 2019’s rate of 5.9 percent. Historically this is a very large surge in growth, year over year. It is also quite a reversal from the trend that only just ended in August of last year, when growth rates were nearly bottoming out around 2 percent. In August 2019, the growth rate hit a 120-month low, falling to the lowest growth rates we’d seen since 2007. The money supply metric used here—the “true” or Rothbard-Salerno money supply measure (TMS)—is the metric developed by Murray Rothbard and Joseph Salerno, and is designed to provide a better measure of money supply fluctuations than M2. The Mises Institute now offers regular updates on this metric and its growth. This measure of the money supply differs from M2 in that it includes Treasury deposits at the Fed (and excludes short-time deposits, traveler’s checks, and retail money funds). The M2 growth rate reached new historic highs in November, growing 25.07 percent compared to October’s growth rate of 24.17 percent. M2 grew 7.06 percent during November of last year. The M2 growth rate had fallen considerably from late 2016 to late 2018 but has been growing again in recent months. As of March, it is following a trend similar to that of TMS, but to a lesser degree. Money supply growth can often be a helpful measure of economic activity. During periods of economic boom, money supply tends to grow quickly as banks make more loans. Recessions, on the other hand, tend to be preceded by periods of slowdown in rates of money supply growth. However, money supply growth tends to grow out of its low-growth trough well before the onset of recession. As recession nears, the TMS growth rate climbs and becomes larger than the M2 growth rate. This occurred in the early months of the 2002 and the 2009 crises. February 2020 was the first month since late 2008 that the TMS growth rate climbed higher than the M2 growth rate. The TMS growth rate has exceeded M2 in most of this year. As the year progresses, it does appear that the decline in money supply growth has again preceded a recession, and a severe one at that. Both the second and third quarters showed negative growth in real GDP this year. The second quarter this year fell 9 percent, year over year, and the third quarter was down 2.9 percent, year over year. |
M2 and TMS/Rothbard-Salerno Measure, 1998-2020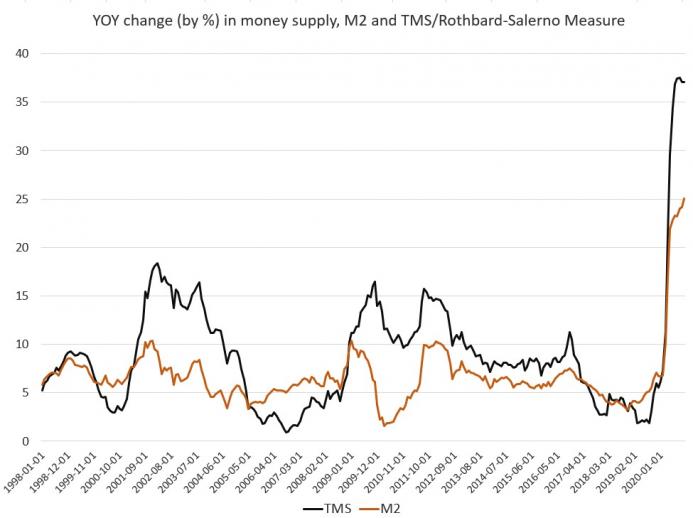 - Click to enlarge |
| Although some observers will likely claim that the current economic crisis is a result solely of the covid-19 panic and resulting government-forced shutdowns, several indicators do suggest that the economy was primed for a recession. The preceding decline in TMS is one of these indicators, as is the late 2019 liquidity crisis in the repo markets. The Fed’s moves to drop interest rates and to once again grow its balance sheet speak to the weakness of the economy leading up to April 2020. Moreover, global trade contracted in 2019 for the first time since the Great Recession, suggesting the world economy was heading toward some form of contraction.
After initial balance sheet growth in late 2019, total Fed assets surged to nearly $7.2 trillion in June and have rarely dipped below the $7 trillion mark since then. As of late November, total assets are again pushing above $7.2 trillion. These new asset purchases have set a new all-time high and are propelling the Fed balance sheet far beyond anything seen during the Great Recession’s stimulus packages. The Fed’s assets are now up more than 600 percent from the period immediately preceding the 2008 financial crisis. While Fed asset purchases are not solely responsible for the surge in new money creation, they are certainly a sizable factor. As expected, bank loan activity has surged as well, also driving new money creation. Below is the dollar volume for M2 and TMS: |
M2 and TMS in billions of $, 1996-2020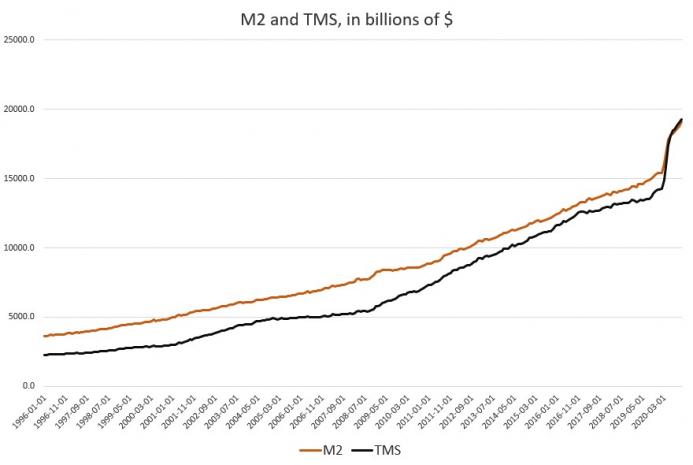 - Click to enlarge |
tms2.png
You Might Also Like
 Monetary and Fiscal Sorcery Make Home Price Magic
2020-09-06
Make the money cheap enough and government intrusive enough, and incongruous headlines appear side by side. For instance, from the Las Vegas Review-Journal comes this head-scratcher: “Las Vegas Housing Market ‘on Fire’ as Economy Limps Along.”
 Howard Buffett: Against Legal Plunder
2020-09-12
In August of 1963, Human Events published an article written by Howard Buffett entitled “’Thou Shalt Not Steal!’ But Government Confiscation Has Been Legalized.”
 Inflation as a Tool of the Radical Left
2020-09-20
“Lenin is said to have declared that the best way to destroy the Capitalist System was to debauch its currency….Lenin was certainly right. There is no subtler, no surer way of overturning the existing basis of society than to debauch the currency.
 Turning to Keynes in this Crisis Will Only Make Things Worse
2020-09-21
In the New York Times on September 8, 2020, Paul Krugman wrote that. The CARES Act, enacted in March, gave the unemployed an extra $600 a week in benefits. This supplement played a crucial role in limiting extreme hardship; poverty may even have gone down.
 Problems with Theories on the Black-White Wealth Gap
2020-10-09
The wealth gap between white and black Americans is frequently discussed. Today it’s becoming popular to attribute disparities to black culture. Clearly all cultures are not equal, but can the subculture of some black American communities explain variations within the wealth gap?
 If We Want to Increase Demand in the Market, We Must First Increase Production
2020-10-20
An individual’s demand is constrained by his production of goods. The more goods an individual produces, the more of other goods he can secure for himself.
 Brain Death: Challenges and Responses
2020-10-27
Does it matter if we call irreversibly comatose patients “dead?” Our guest is Doyen Nguyen, OP, MD, STD. Dr. Nguyen was previously an academic hemato-pathologist and is currently a Catholic moral theologian and bioethicist.
 No, the American Republic Was Not Founded on Slavery
2020-10-30
Journalistic propaganda is a powerful instrument of indoctrination. Without evidence, foul ideas can easily penetrate mainstream discourse. For instance, recently it has become fashionable to posit that slavery is America’s original sin.
Tags: Featured,newsletter