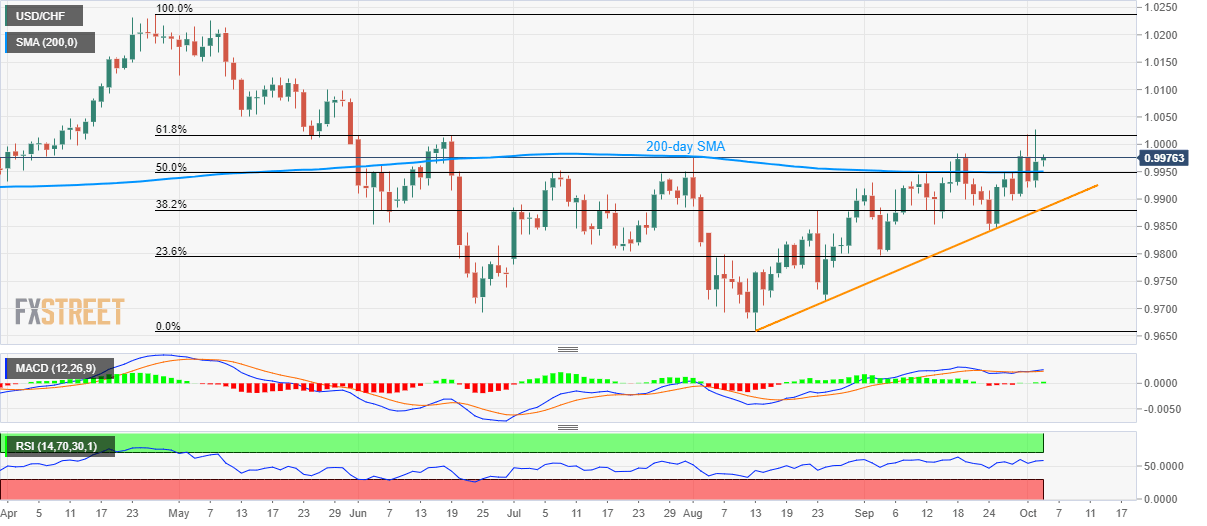
USD/CHF stays positive above 200-day SMA, 50% Fibonacci retracement. A sustained run-up beyond 61.8% Fibonacci retracement can aim for late-May highs. Despite successfully trading above key support confluence, the USD/CHF pair fails to provide a daily closing above 61.8% Fibonacci retracement of April-August downpour. The quote takes the bids to 0.9975 while heading into the European open on Thursday. Given the bullish signals from 12-bar moving average convergence and divergence (MACD) and 14-bar relative strength index (RSI), the pair is likely to extend north-run towards late-May highs surrounding 1.0100 if successfully closing above the key Fibonacci retracement level of 1.0016. On the contrary, a 200-day simple moving average (SMA) and 50% Fibonacci
Topics:
Anil Panchal considers the following as important: 1.) FXStreet on SNB&CHF, 1) SNB and CHF, Featured, newsletter, USD/CHF
This could be interesting, too:
Nachrichten Ticker - www.finanzen.ch writes Die Performance der Kryptowährungen in KW 9: Das hat sich bei Bitcoin, Ether & Co. getan
Nachrichten Ticker - www.finanzen.ch writes Wer verbirgt sich hinter der Ethereum-Technologie?
Martin Hartmann writes Eine Analyse nach den Lehren von Milton Friedman
Marc Chandler writes March 2025 Monthly
- USD/CHF stays positive above 200-day SMA, 50% Fibonacci retracement.
- A sustained run-up beyond 61.8% Fibonacci retracement can aim for late-May highs.
| Despite successfully trading above key support confluence, the USD/CHF pair fails to provide a daily closing above 61.8% Fibonacci retracement of April-August downpour. The quote takes the bids to 0.9975 while heading into the European open on Thursday.
Given the bullish signals from 12-bar moving average convergence and divergence (MACD) and 14-bar relative strength index (RSI), the pair is likely to extend north-run towards late-May highs surrounding 1.0100 if successfully closing above the key Fibonacci retracement level of 1.0016. On the contrary, a 200-day simple moving average (SMA) and 50% Fibonacci retracement offer important support close to 0.9948/50, a break of which could quick drag prices to the six-week-old rising trend-line, at 0.9880. If at all bears manage to dominate below 0.9880, 0.9845/40 and 0.9800 will appear on their watch-list. |
USD/CHF daily chart, April-October 2019(see more posts on USD/CHF, ) |
Trend: bullish
Tags: Featured,newsletter,USD/CHF

