The evidence continues to pile up for increasing slack in the US economy. While that doesn’t necessarily mean there is a recession looming, it sure doesn’t help in that regard. Besides, more slack after ten years of it is the real story. The Federal Reserve’s favorite inflation measure in October 2019 stood at 1.31%, matching February for the lowest in several years. Despite constantly referencing a tight labor market and its fabulous unemployment rate, broad pricing pressures remain scant. PCE Chain-type Price Index, 2009-2019 - Click to enlarge Specific prices are another story, as is typically the case. Food and at times fuel (based on the oil market’s dollar-biased mood) set most people’s expectations for how inflation is affecting their own
Topics:
Jeffrey P. Snider considers the following as important: 5.) Alhambra Investments, core inflation, core pce deflator, currencies, economy, Featured, Federal Reserve/Monetary Policy, inflation, ism manufacturing index, ism non manufacturing index, manufacturing, Markets, newsletter, pce deflator, services, slack
This could be interesting, too:
Nachrichten Ticker - www.finanzen.ch writes Die Performance der Kryptowährungen in KW 9: Das hat sich bei Bitcoin, Ether & Co. getan
Nachrichten Ticker - www.finanzen.ch writes Wer verbirgt sich hinter der Ethereum-Technologie?
Martin Hartmann writes Eine Analyse nach den Lehren von Milton Friedman
Marc Chandler writes March 2025 Monthly
|
The evidence continues to pile up for increasing slack in the US economy. While that doesn’t necessarily mean there is a recession looming, it sure doesn’t help in that regard. Besides, more slack after ten years of it is the real story. The Federal Reserve’s favorite inflation measure in October 2019 stood at 1.31%, matching February for the lowest in several years. Despite constantly referencing a tight labor market and its fabulous unemployment rate, broad pricing pressures remain scant. |
PCE Chain-type Price Index, 2009-2019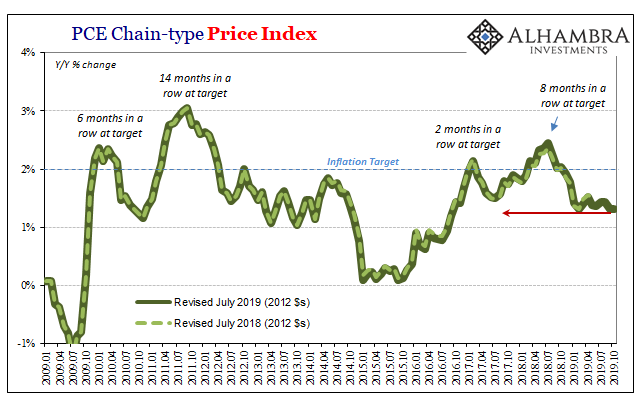 - Click to enlarge |
Specific prices are another story, as is typically the case. Food and at times fuel (based on the oil market’s dollar-biased mood) set most people’s expectations for how inflation is affecting their own circumstances and therefore how they perceive them. But even if food price inflation, for instance, is “hot” that doesn’t necessarily mean there is inflation inflation.
|
PCE Chain-type Price Index, 2000-2019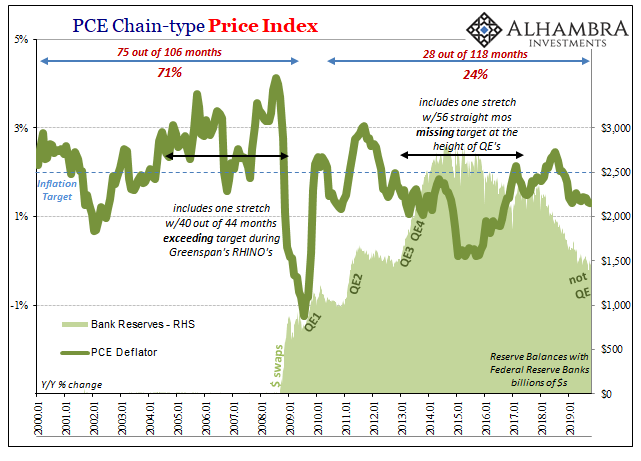 - Click to enlarge |
| It is substantial. By the very nature of food and food shopping, and how you pay for groceries more directly, that price increase sticks in your mind for the amount you’re pinched.
However, during the same month Verizon suddenly lets you switch to an unlimited wireless data plan which takes your monthly bill from, say, $195 down to $160. You may not, and most do not, factor that into your “feel” of general consumer prices (nor do you factor how everything once contained within a phone book is now available with your Verizon plan already on your “mobile device”; that’s another story, though). You sense 6% inflation even though overall (in just this two item “basket”) your actual price increase is just a smidge less than 2.1%. That much is apparent when stripping out food and fuel, looking at only the so-called core PCE Deflator. After several months near and slightly above 2% in 2018, the rate is once again meandering its way downward as it had during each prior recognizable eurodollar-based downturn. In other words, not just Verizons but many businesses unable to increase prices or even more of them turning to discounts (at the margins). |
PCE Chain-type Price Index, 2010-2019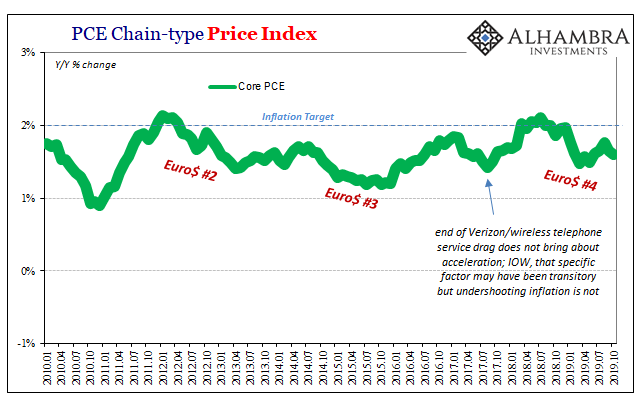 - Click to enlarge |
| In one word: slack. More of it. As noted yesterday, it’s the same across business prices, things like the Producer Price Index which has picked up a growing disdain for any charged increases.
It gives us a reason for why other indications like the ISM’s various PMI’s refuse to play ball with the recession-is-behind-us narrative. Weakness remains stubborn while, again, whether it leads to recession or not is the wrong focus. The ISM, the inflation data, corporate numbers, etc., they all suggest downturn and that’s what’s really important. The recession case is really arguing over the possible severity of what is already the latest one, forgetting how much more important it is that the (global) economy has never recovered from the last one(s).
And that’s just what the ISM is saying. Its Manufacturing PMI “unexpectedly” failed to register a rebound for November (as well as the Chicago Business Barometer), and now its Non-manufacturing number “unexpectedly” declined in the latest estimate for last month. |
ISM Purchasing Managers Indexes, 2008-2019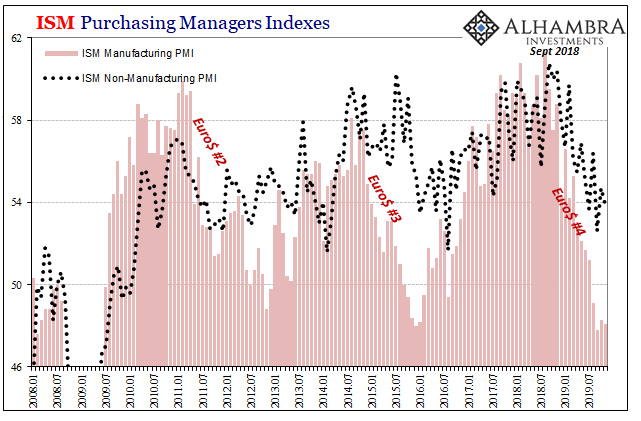 - Click to enlarge |
| The reason it wasn’t expected is because the very idea of a downturn gets lost in the recession nonsense. The yield curve un-inverted which has wrongly led too many to assume that’s the final word.
We have the downturn; it’s clear enough in the data. We don’t know where it ends, meaning how far down is down, but, again, the worst case has already materialized and been confirmed. Since last year’s landmine, the mainstream media has been practically schizophrenic when it comes to these services numbers – understandably so. Unlike manufacturing, which is almost certainly experiencing something like a recession, the 21st century US economy is one predicated on the consumption of services. It’s easy (though still wrong) to dismiss serious weakness in manufacturing, much more difficult (and more wrong) to do so where the services side is concerned. |
ISM Purchasing Managers Indexes, 2017-2019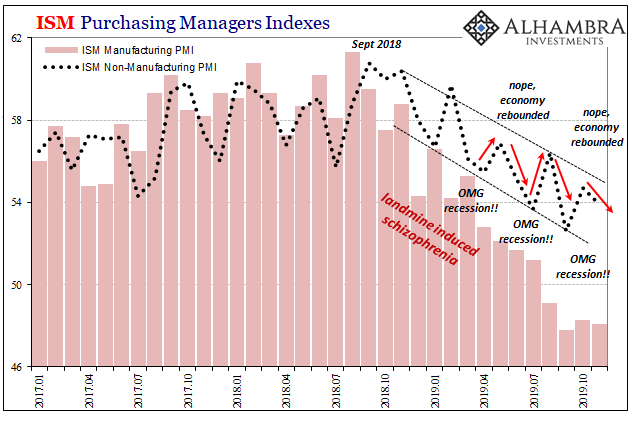 - Click to enlarge |
| Therefore, though the ISM Non-manufacturing PMI is obviously noisy month to month, each and every minor uptick is played up as the end of the danger – particularly the last couple.
Instead, the index held to form where it tends to rise one month and then fall the next two: down last December and this January, up in February (sparking the “green shoots”); down March and April, up in May (reigniting the “green shoots”); except down again both June and July, you get the point. The ISM’s sentiment indices are the other side of the PCE Deflator; slackening in demand which is causing slightly more negative pressures on corporate prices and pricing. |
China Industrial Production, 1998-2019(see more posts on China Industrial Production, )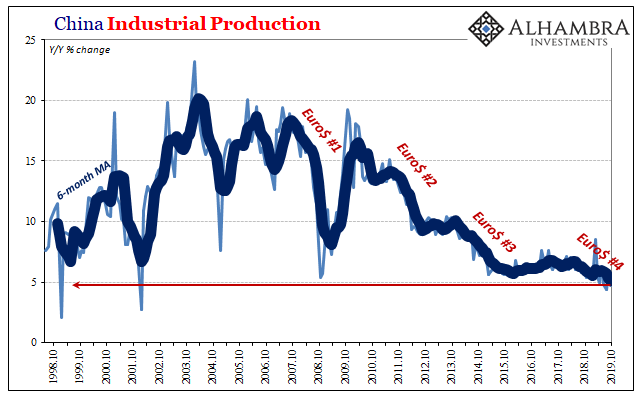 - Click to enlarge |
| That it has infected services means those pressures must be substantial.
It doesn’t take recession, and it doesn’t need recession. Globally synchronized growth really was the third false dawn of the last decade. That’s a big deal in the US, and other places around the world a much, much bigger one. |
India Industrial Production, 1996-2018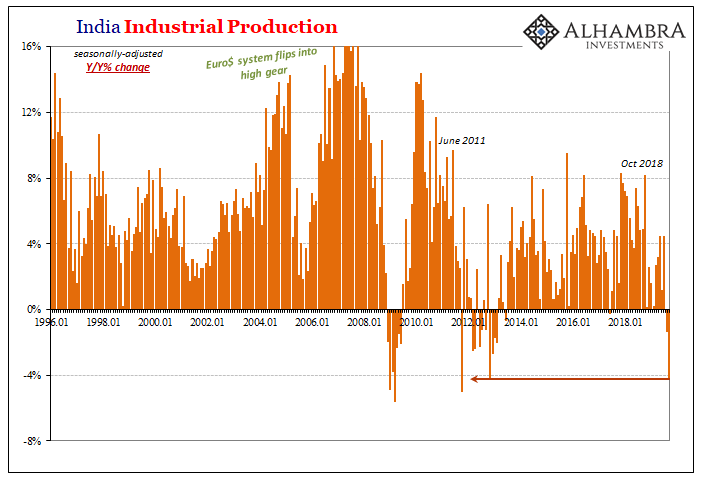 - Click to enlarge |
ISM Chicago Business Barometer, 2007-2019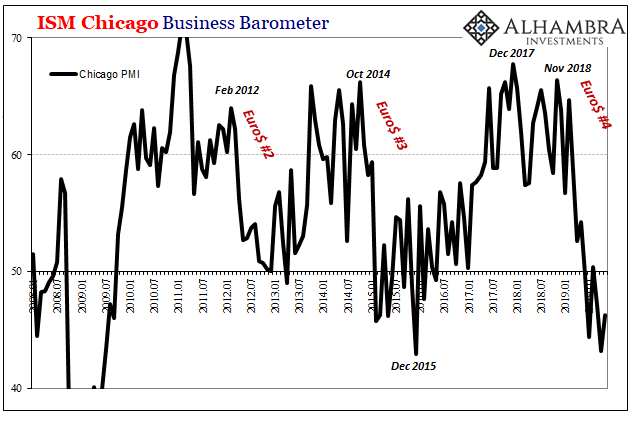 - Click to enlarge |
Tags: Core Inflation,core pce deflator,currencies,economy,Featured,Federal Reserve/Monetary Policy,inflation,ism manufacturing index,ism non manufacturing index,manufacturing,Markets,newsletter,pce deflator,services,slack