Quantity Theory Revisited The price of gold fell another ten bucks and that of silver another 28 cents last week. Perspective: if you are waiting for the right moment to buy, the market is offering you a better deal than it did last week (literally, the market price of gold is at a 7.2% discount to the fundamental price vs. 4.6% last week). If you wanted to sell, this wasn’t a good week to wait. Which is your intention, and why? Gold vs. TMS excl. memorandum items (the latter add several 100 billion dollars to the recent total, but currency & deposit money represent the bulk of TMS-2 – we chose this version because it allowed us to make a longer-term chart). It is obvious that there is no 1:1, instantaneous
Topics:
Keith Weiner considers the following as important: 6) Gold and Austrian Economics, Chart Update, Crypto-currencies, Featured, newsletter, Precious Metals
This could be interesting, too:
Nachrichten Ticker - www.finanzen.ch writes Die Performance der Kryptowährungen in KW 9: Das hat sich bei Bitcoin, Ether & Co. getan
Nachrichten Ticker - www.finanzen.ch writes Wer verbirgt sich hinter der Ethereum-Technologie?
Martin Hartmann writes Eine Analyse nach den Lehren von Milton Friedman
Marc Chandler writes March 2025 Monthly
Quantity Theory RevisitedThe price of gold fell another ten bucks and that of silver another 28 cents last week. Perspective: if you are waiting for the right moment to buy, the market is offering you a better deal than it did last week (literally, the market price of gold is at a 7.2% discount to the fundamental price vs. 4.6% last week). If you wanted to sell, this wasn’t a good week to wait. Which is your intention, and why? Gold vs. TMS excl. memorandum items (the latter add several 100 billion dollars to the recent total, but currency & deposit money represent the bulk of TMS-2 – we chose this version because it allowed us to make a longer-term chart). It is obvious that there is no 1:1, instantaneous correlation between the quantity of money and prices – in this case, the gold price – far from it. However, no-one is saying that anyway, as far as we are aware. The purchasing power of money depends on four factors: the supply of and the demand for money, and the supply of and demand for goods and services. Nevertheless, it is undeniable that prices are not independent of the money supply. With respect to the gold price, the chart above simply shows that there are leads and lags between the quantity of outstanding dollars and the gold price – these can certainly be lengthy, but that is what the periods when the two drift apart represent. The gold price (and all other nominal prices in the economy for that matter) would not have experienced such a large long term increase if the money supply had remained stable. Most of the time, changes in the money supply growth are not very useful for forecasting short term trends in the gold price, but the size of the money stock and the price of gold do correlate over the long term. Mises described the effect of inflation (inflation = an increase in the money supply) on prices as follows: “The course of a progressing inflation is this: At the beginning the inflow of additional money makes the prices of some commodities and services rise; other prices rise later. The price rise affects the various commodities and services, as has been shown, at different dates and to a different extent. This first stage of the inflationary process may last for many years. While it lasts, the prices of many goods and services are not yet adjusted to the altered money relation. There are still people in the country who have not yet become aware of the fact that they are confronted with a price revolution which will finally result in a considerable rise of all prices, although the extent of this rise will not be the same in the various commodities and services.” Elsewhere Mises remarks that economic productivity has often matched or even outpaced monetary inflation, and in those periods nominal price increases were occasionally suppressed altogether: “A sharp rise in commodity prices is not always an attending phenomenon of the boom. The increase of the quantity of fiduciary media certainly always has the potential effect of making prices rise. But it may happen that at the same time forces operating in the opposite direction are strong enough to keep the rise in prices within narrow limits or even to remove it entirely. […] As an actual historical event credit expansion was always embedded in an environment in which powerful factors were counteracting its tendency to raise prices. As a rule the resultant of the clash of opposite forces was a preponderance of those producing a rise in prices. But there were some exceptional instances too in which the upward movement of prices was only slight.” [emphasis added] |
US Money Suppaly vs Gold Price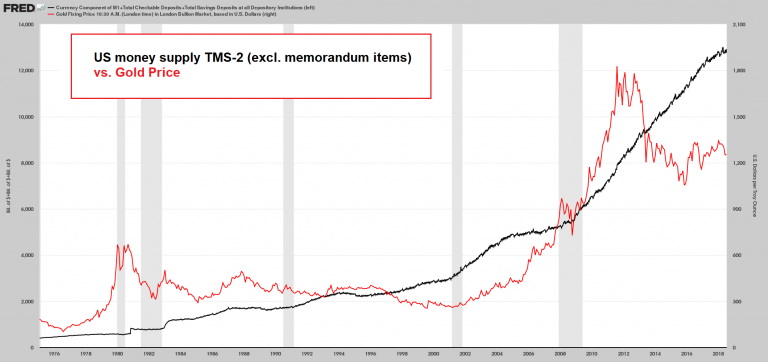 Gold is a monetary asset, i.e., the market-chosen money commodity. As such, it behaves like a currency and its long term correlation with USD money supply growth is actually quite pronounced. The supply of gold grows at a very slow pace, and as long as the market treats it like money, its price will tend to rise in the long term relative to currencies with a faster growing supply. In the short to medium term other macroeconomic factors are most of the time more important gold price drivers. It should be noted though that in today’s central bank-administered fiat money system, these other factors also tend to have a lead-lag relationship with money supply growth rates. After all, the latter are driven by central bank policy, which in turn is generally formulated in response to macroeconomic developments. [PT] - Click to enlarge |
| We have written many times that the quantity of dollars does not cause the price of gold to rise. Two weeks ago, we showed a graph of M2 overlaid with the gold price. While the price of gold has generally been rising over the long term, there are long periods of rising quantity of what most call money, with flat or falling gold price. How can this be? If an increase in the quantity of money does not make prices go up, what does?
A price goes up if and only if a buyer takes a seller’s offer. If buyers repeatedly take the offer, then the offer will keep moving up, and not stop moving up, until buyers stop taking the offer. OK, the theory of price formation is nice, but what makes buyers keep taking the offer, while the price relentlessly moves up? In any other commodity, where purchase is for consumption, this process could occur if there is a shortage. For example, if there is too much rain and not enough sun, the wheat harvest could come in less than expected. Buyers will eagerly bid up the price. Some are eager to secure the wheat they need to bake their bread, and others to profit by buying ahead of this demand and selling into it. But gold is not purchased to be consumed. And the concept of shortage is inapplicable to something which has been accumulated for millennia (think about this, it is a simple observation of fact, but rife with important implications). And in gold, most sellers are not producers. They are holders of gold inventory. Sellers are decreasing their inventory, enabling buyers to increase theirs. This is one reason why we are uninterested in the India or China or Russia import statistics (or alleged statistics). |
 We agree completely with Keith that statistics such as gold imports into certain countries have no bearing on the gold price. Why would movement of gold from A to B have any effect on its price? We have never quite understood why so many people have declared this to be a big deal. - Click to enlarge But we must again point out that even in the case of commodities which are consumed, money supply growth is the decisive factor pushing their nominal prices up in the long term. We offer the above empirical proof, in the form of McDonald’s menus from 1955, 1972, 1976 and 2012. In 2012 a cheeseburger was ~10 times more expensive than in 1972, and ~17 times more expensive than in 1955 (assuming that the smaller servings of today are equivalent to the cheeseburgers of the past). Why? Is there a steadily worsening shortage of beef and cheese since the 1950s we haven’t been apprised of? We would suggest that money supply growth is the main culprit. Note: many things are nowadays much cheaper in real terms than in the past, particularly manufactured goods – but this discussion obviously focuses exclusively on nominal prices. [PT] |
Gold Changes HandsWhen gold moves from one hand to another, then that does not even tell us if buyers lifted the offer or if sellers pressed the bid. Much less, whether buyers will lift offers or sellers will press bids—i.e., help us predict where the price will go next. In gold, inventory is shifted from one party to another. If the shift occurs because a motivated buyer takes the offer of a seller who offers at his leisure, then the shift occurs on an uptick in price. On the other hand, if the seller is motivated, accepting the bid of a leisurely buyer, then the price ticks down. It is no more possible to identify who these parties are, than to inventory the total amount of gold they hold in aggregate. Suffice to say there are many of them, both in the third world and in the developed countries. We said “alleged statistics” above, because if there are many motives to under- or over-report (as the case may be), with no audit or other means of verification. Reported statistics are not necessarily true. So back to our question. What is making people sell their gold and silver and press down the bid price? What would make them reverse and begin buying and lifting the offer price? Macro AggregatesIt is not driven by changes in the money supply (so called) as we saw a few weeks ago. One could plot change in money supply with the gold price. We encourage anyone to go to the FRED website published by the St. Louis Fed. T he site lets you play with different ways of plotting the data, and overlaying different things such as gold price on top of the percent change of the M2 money supply from a year ago .There are times when the price of gold correlates well with changes in money supply. And times when does the opposite. This should be a red flag. And it illustrates a problem with macroeconomic aggregates. If you don’t have a clear picture of the mechanics of what causes what, and why it causes it, then you’re assuming relationships because it seems to make “common sense” or because there are periods when there is a correlation. The question is why? Is the correlation because many market participants believe the gold price is supposed to change with changes in the money supply — and their buying and selling self-fulfills the prophecy? Is it because reality is just a bit more complicated, for example is there one more unexamined variable (or several)? Is the system non-linear? Is the system “stateful”, that is do market participants have memory and change their response to the same setup? Is the system dynamic, with such things as inertia or even resonance, and positive feedback? These factors are discussed in my theory of interest and prices. Like it, or not, in the US and to a large but slightly lesser degree throughout the West, gold is not taken seriously by mainstream investors or the financial media. To the extent people think about it, it is just another chip for betting in the casino that we now call markets. If something (e.g. the issuance of the first gold bond in 85 years) were to change this perception, gold could be re-rated. In the meantime, mainstream investors aren’t touching it, and that much-smaller group of traders who sometimes buys it sees little to make them buy right now. And why should they? They react to the price action. They have the same price chart that everyone else has. If you tell them buy gold because of rising debt or China or whatever, they will say, well those stories have been true since the price peaked in 2011. A few may fancy themselves contrarians, and may buy now. Or they may have bought any time this year, and then sold — or could be about to sell. |
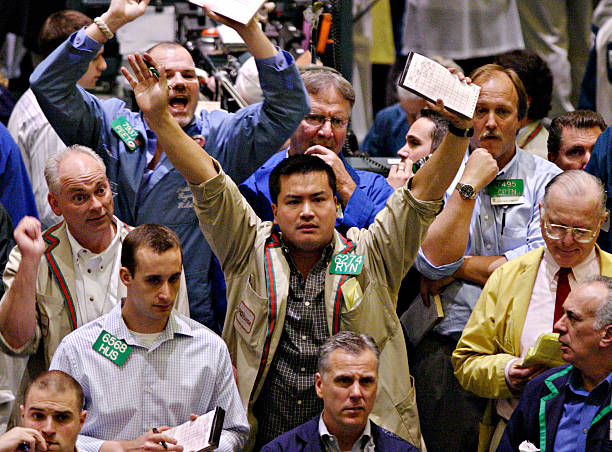 The good old days: open outcry gold futures trading pit in New York. It is certainly possible to draw up a list of macroeconomic drivers that are important for gold price formation, and it can be explained why they are important. - Click to enlarge Which one of them the market focuses on most at any given time is certainly subject to change, but if a majority of these drivers looks either bullish or bearish, it is highly likely that the trend in the gold price will reflect that. We would also note that retail investors are not all that important in this context – people and institutions with large amounts of assets to protect are. [PT] Photo credit: Bloomberg / Getty Images |
Country Specific FactorsIn India, it is probably grossly oversimplified to say that the people buy when they have spare money. Unfortunately, their currency just goes down and down in recent years. As it falls, the Indian people are squeezed by rising cost of living, and surely wages are not keeping up. So their desire to buy gold may be undiminished, but their means are. The Indian rupee did have a good 20% rally from March 2009 to August 2011… what was happening to the gold price at that time? In China, the picture is more complicated. Many people think of gold traditionally as money. Yet many others share the view of Westerners: they want to own whatever assets are going up. Is the demand of the former satiated by the gold supplied by the selling of the latter? What are the factors that cause demand to rise and fall? The Chinese yuan fell for three years from January 2014 through December 2016. It rallied during 2017, retracing just a bit more than a Fibonacci target (61.8% of the drop). Since late April it has been dropping hard. It should be noted that a falling currency impacts these two different groups quite differently. The people who accumulate gold because it is traditional money are not using leverage. These are generally not the rich. As the currency drops, so does their means to buy gold. Traders typically have access to leverage. Not only is a falling currency, therefore, no impediment to their buying, but it paints an attractive chart. They want whatever is going up, and this time we put the term in italics because the Indian who sees gold rising is seeing a different picture than the American who sees it falling. Who is correct? Which falling paper currency gives the accurate view of gold? (trick question) As an aside, a whole economic thesis could be developed around this idea that a falling currency both enables and incentivizes the use of leverage for those who have access to credit. But at the same time, it diminishes most people’s access to goods. Anyway, to the trader using leverage, the more his local currency is falling the more he wants to buy gold. So now we have a dilemma. Which of these two groups has the dominant influence on the gold price, as least so far as China is concerned? To answer, one would need far more knowledge of the country and its dynamics than we possess. How about Italy or Spain? Both have lingering doubts about the currency they may be using in the future. Might some of the wealthy class in these countries buy gold as a hedge, rather than as a bet on its price? For all the pain of Brexit constipation, at least the UK did not get tangled in the euro. Brits know what currency they will be using, though not its value. The pound has a dollar exchange rate that not too long ago was assigned the euro ($1.31). Might Brits buy a bit of gold, out of an abundance of caution of course, and not exactly furtively but not to be discussed openly either… One could go through this kind of analysis country by country. The result might be, perhaps, a picture of whether that country is driving the price up or down. |
Japanese Yen and Gold in USD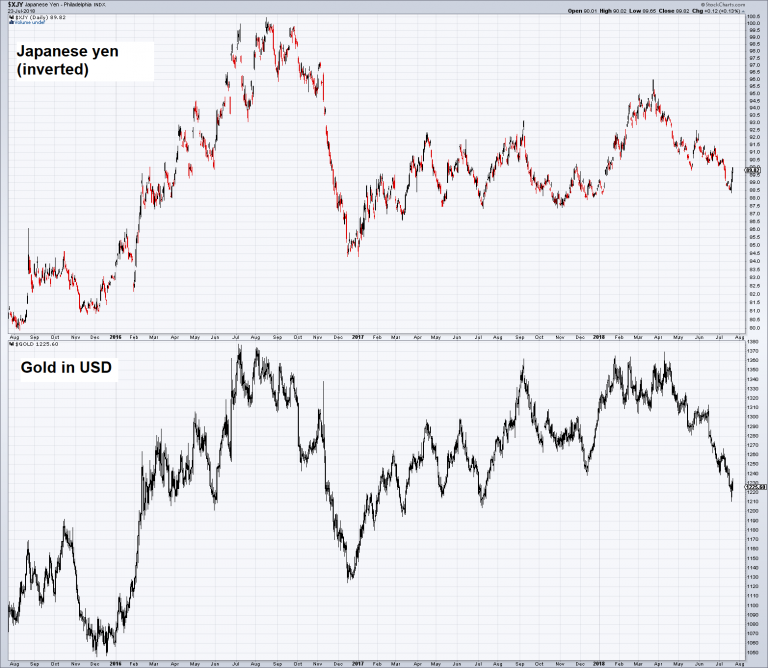 Interestingly, the foreign currency that is most closely correlated with the USD gold price is the Japanese yen (here shown inverted from the usual USD/JPY depiction). Naturally it’s not a perfect correlation, but it is quite strong – it can be easily discerned at a quick glance. The reason is very likely that both the yen and gold tend to strengthen when risk aversion in financial markets increases – at least that has been the case in the past ten years. [PT] - Click to enlarge |
BitcoinNext we come to bitcoin. For a few years, those who wanted to speculate on the collapse of the dollar and Western civilization, or at lease use that story as the pretext to buy an asset to make a dollar profit, surely would have to be enamored of this cryptocurrency. How could gold or even silver compete against something that went up twenty-fold in a year? As an aside, many bitcoin bettors gave snide responses to our long series on the monetary economics of bitcoin. They could mostly be summed up as “how’s that gold price working out for ya?” Bitcoin may not compete with gold for the money function, but hey it sure competes for the going-up function! Now that bitcoin’s price has broken down, its future is a bit cloudier. And even a proponent of unbacked pure cryptocurrencies, like Lars Christensen, founder of Saxo Bank has said, at the recent OCON, that newer technologies will make bitcoin obsolete. |
Bitcoin Chart Daily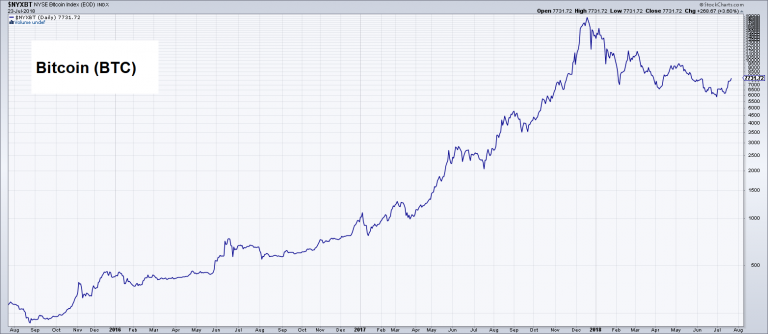 BTC over the past three years (the price average of several exchanges in the form of the NYSE Bitcoin index). We should note to Mr Christensen’s remark (quoted further below) that if its technological prowess were the main determinant of BTC’s price, a number of competing cryptocurrencies should already be trading at a higher price. - Click to enlarge To name two examples, BCH (which has a 32 times larger blocksize and offers much faster and cheaper transfers) and Z-Cash (which offers private addresses and untraceable transfers and is also much faster) are BTC forks with the exact same ultimate supply. Both should be trading at a higher price than BTC if technological superiority were seen as an important valuation criterion – but they don’t, not by a long shot. BTC’s first mover advantage has so far proven to be an extremely powerful feature and seems to count for more in the minds of traders and investors. Anyway, “obsolescence” does not appear to be a threat to BTC so far (admittedly that could change in the future). [PT] |
Crying WolfI just returned from the Sprott Resources Conference. One theme at the conference was the idea of crying wolf. This is the elephant in the gold room. Grant Williams talked about it (and a lot more, including the same possible paths to the gold standard that we discussed last week in the Great Gold Upgrade). Crying wolf is a simple theme from Aesop’s Fables. A shepherd boy keeps calling the villagers when there is no wolf. When the wolf finally comes, and he cries out, no one believes him, and bad things ensue. At the Sprott conference, Rick Rule (laughingly) mentioned that he had “successfully called 18 of the past 3” stock market drops. We bring this up because gold is often touted, not just as the asset which will go up when the dollar collapses to its intrinsic value, but as insurance. It is a good thing to own when the world is crashing down around your ears. That may be true, but what if people don’t really believe that the world-crashing wolf is anywhere near? Who would tell them, and would anyone believe at this point? Is the wolf actually near right now? Adam Smith told us that “there is a great deal of ruin in a nation.” The Fed did nearly everything that the wolf-crying boy said it would do, but none of the wolves have come. And what’s more, every mainstream statistic shows the economy is doing well, GDP is up, employment is up, etc. In other words, we seem to be moving away from calamity. We’re not, but that’s not the point. Try to put yourself into the mindset of someone who took the blue pill. Why on earth should they buy gold right now? The economy is going up and gold is going down! Yes, yes, we know. There are more fallacies in that simple sentence than there are words. The blue pill eaters are temporarily right for the wrong reasons. This is just a long-winded way of explaining why we are so obsessed with measuring what gold market participants are actually doing in the gold market. Unlike old stories, the gold basis changes dynamically. And it does not have the problem of trying to net the gold-saving peasants with the leveraged gold futures buying wealthy, within one country much less netting India with Spain and China with the UK and US. And a bonus: we don’t need to look at what bond market participants are doing in the bond market, inflation participants are doing in the CPI market, and GDP market participants are doing in the GDP market (please allow us our humor, there is a real economist who has proposed a GDP futures market, to support his vision of how the Fed could better centrally plan our economy). |
|
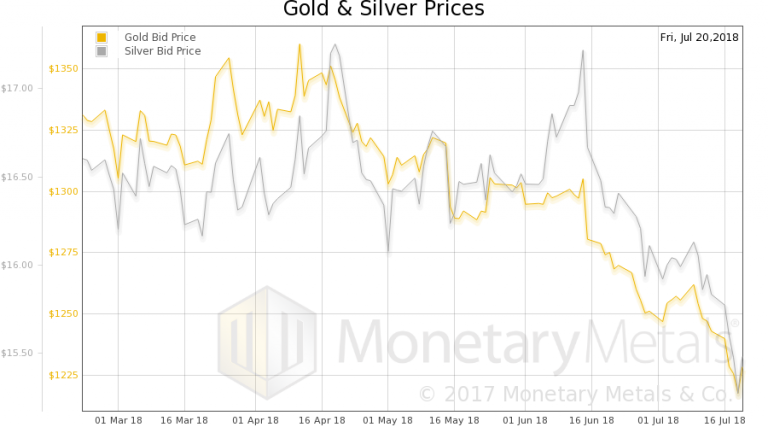
Fundamental DevelopmentsAll those factors, and plenty more, are taken into account by the basis. And there can be big changes in the supply and demand fundamentals, such as the rise in the first four months of this year, followed by the fall for the next two. So whither the price of gold next? We will provide a picture of the changing gold and silver fundamentals. But first, here is the chart of the prices of gold and silver. |
Gold and Silver Price(see more posts on gold price, silver price, ) |
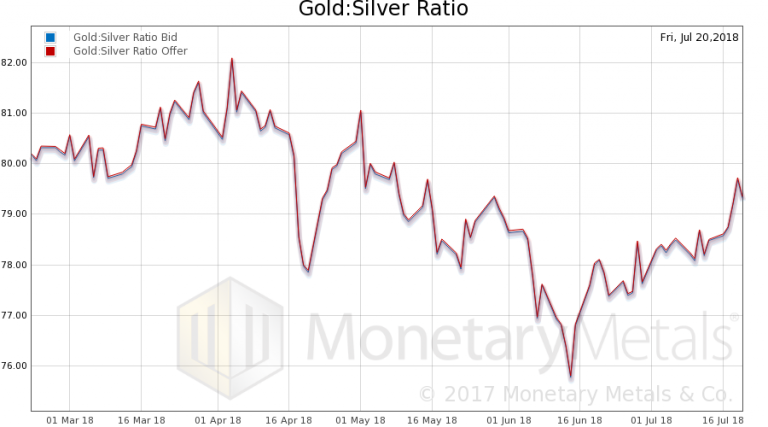
| Next, this is a graph of the gold price measured in silver, otherwise known as the gold to silver ratio (see here for an explanation of bid and offer prices for the ratio). It went up this week. |
Gold:Silver Ratio(see more posts on gold silver ratio, ) |
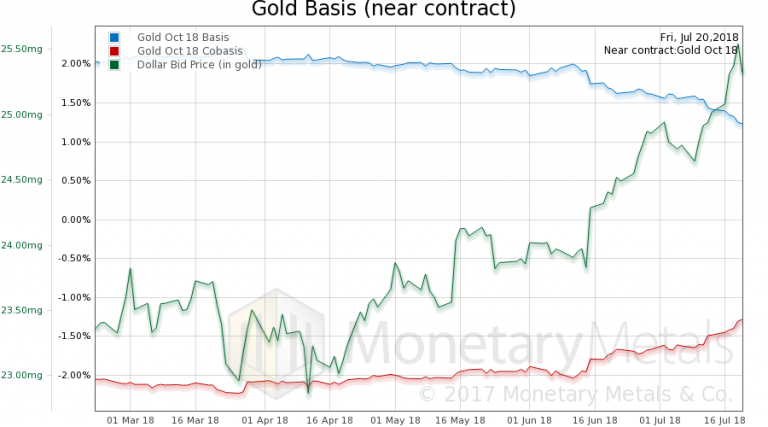
| Here is the gold graph showing gold basis, co-basis and the price of the dollar in terms of gold price.
Look at that – scarcity (i.e., the co-basis) rising, along with the rising dollar price (i.e. inverse of the price of gold measured in dollars). The Monetary Metals Gold Fundamental Price went up $17 this week to $1,317. Is this the end of the falling fundamental price of gold? It has not really dropped since late June. On Friday it jumped up. We shall have to see before calling this with any confidence. |
Gold Basis and Co-basis and the Dollar Price(see more posts on dollar price, gold basis, Gold co-basis, ) |
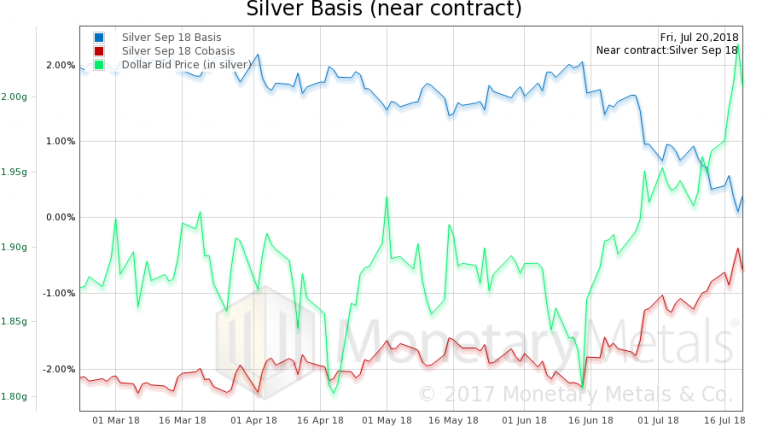
| Now let’s look at silver.
In silver, we see the co-basis moving with the dollar. The Monetary Metals Silver Fundamental Price fell over 20 cents, to $17.22. |
Silver Basis and Co-basis and the Dollar Price(see more posts on dollar price, silver basis, Silver co-basis, ) |
© 2018 Monetary Metals
Charts by: St. Louis Fed, stockcharts, Monetary Metals
Chart and image captions by PT
Tags: Chart Update,Crypto - Currencies,Featured,newsletter,Precious Metals


