USD/CHF The USDCHF pair attempted to breach 0.9581 level yesterday but it returns to move below it now, which keeps the bearish trend scenario valid until now, supported by stochastic move within the overbought areas, waiting to head towards 0.9488 as a first target. We reminding you that confirming breaching 0.9581 will push the price to visit 61.8% Fibonacci correction level at 0.9675 before any new attempt to resume the general bearish trend. Expected trading range for today is between 0.9500 support and 0.9640 resistance. USD/CHF, April 04(see more posts on USD/CHF, ) Source: economies.com - Click to enlarge Gold – Daily Chart Gold - Daily Chart with Technical Indicators, April 02 - Click to
Topics:
Andreas Georgiou considers the following as important: 4) FX Trends, Australian Dollar, Bollinger Bands, British Pound, Canadian Dollar, Crude Oil, Euro, Euro Dollar, Featured, Gold, Japanese Yen, MACDs Moving Average, newslettersent, RSI Relative Strength, S&P 500 Index, S&P 500 Index, Stochastics, Swiss Franc Index, U.S. Dollar Index, U.S. Treasuries, USD/CAD, USD/CHF, USD/JPY
This could be interesting, too:
Nachrichten Ticker - www.finanzen.ch writes Die Performance der Kryptowährungen in KW 9: Das hat sich bei Bitcoin, Ether & Co. getan
Nachrichten Ticker - www.finanzen.ch writes Wer verbirgt sich hinter der Ethereum-Technologie?
Marc Chandler writes March 2025 Monthly
Mark Thornton writes Is Amazon a Union-Busting Leviathan?
USD/CHFThe USDCHF pair attempted to breach 0.9581 level yesterday but it returns to move below it now, which keeps the bearish trend scenario valid until now, supported by stochastic move within the overbought areas, waiting to head towards 0.9488 as a first target. We reminding you that confirming breaching 0.9581 will push the price to visit 61.8% Fibonacci correction level at 0.9675 before any new attempt to resume the general bearish trend. Expected trading range for today is between 0.9500 support and 0.9640 resistance. |
USD/CHF, April 04(see more posts on USD/CHF, )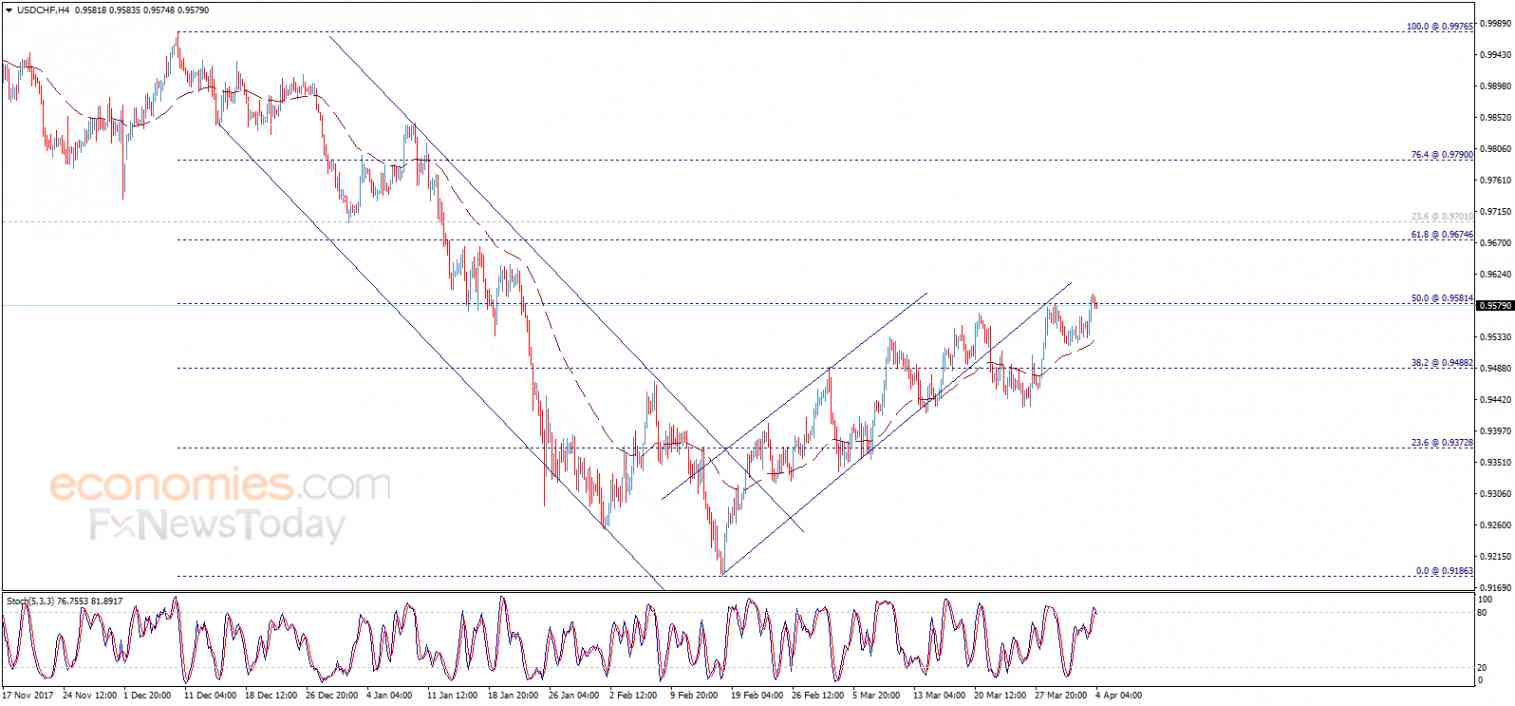 Source: economies.com - Click to enlarge |
Gold – Daily Chart
|
Gold - Daily Chart with Technical Indicators, April 02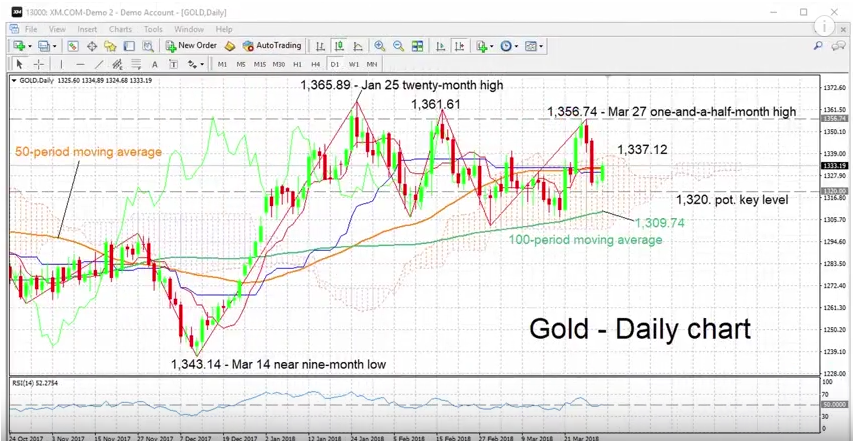 - Click to enlarge |
WTI Oil Futures
|
WTI Oil Futures with Technical Indicators, April 02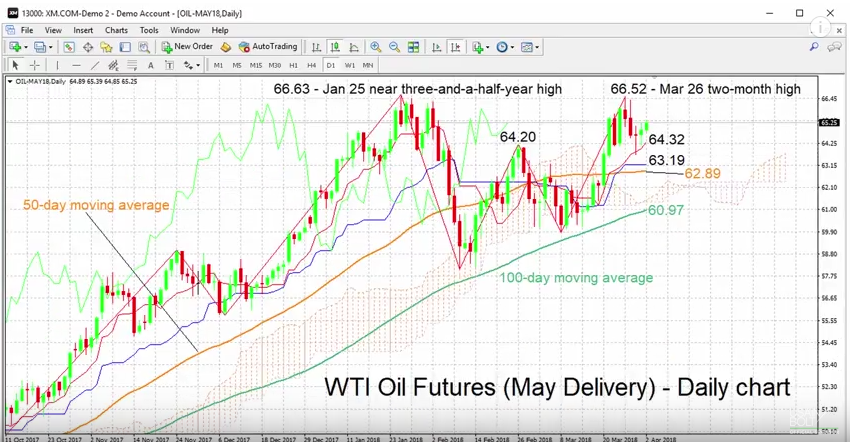 - Click to enlarge |
Germany 30 Index – Daily Chart
|
Germany 30 Index - Daily Chart with Technical Indicators, April 02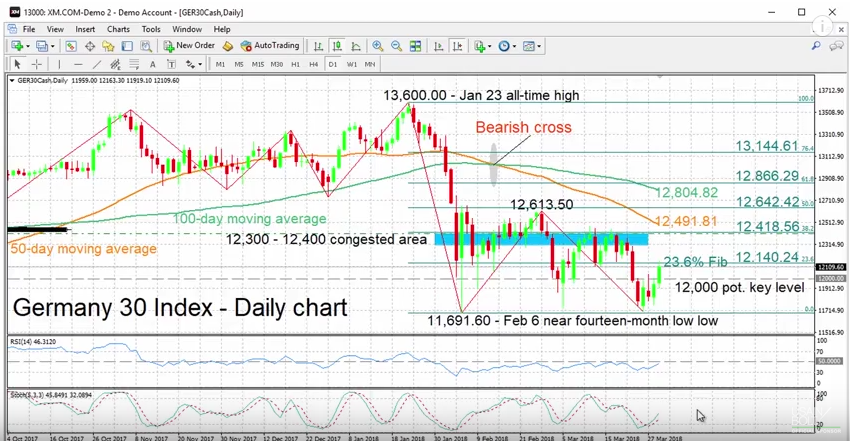 - Click to enlarge |
USD/JPY – Daily Chart
|
USD/JPY - Daily Chart with Technical Indicators, April 02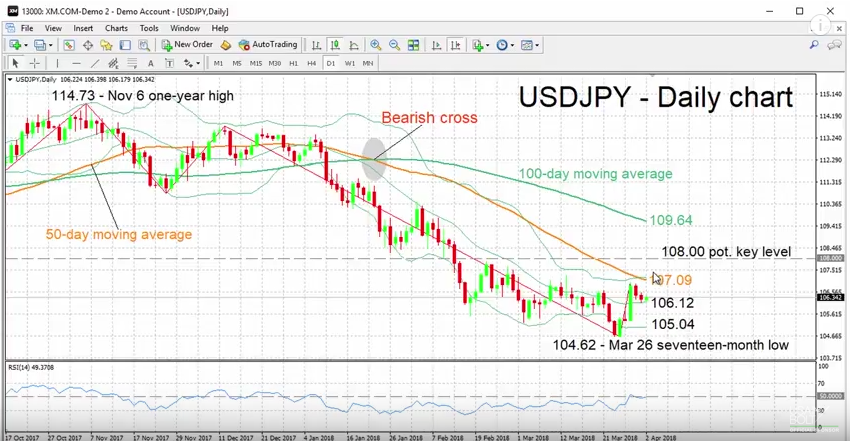 - Click to enlarge |
Tags: Australian Dollar,Bollinger Bands,British Pound,Canadian Dollar,Crude Oil,Euro,Euro Dollar,Featured,Gold,Japanese yen,MACDs Moving Average,newslettersent,RSI Relative Strength,S&P 500 Index,Stochastics,Swiss Franc Index,U.S. Dollar Index,U.S. Treasuries,usd-jpy,usd/cad,USD/CHF