Introduction Being a small open economy Switzerland is highly exposed to the girations of the world economy, both through international trade and financial flows. The country’s trade surplus for instance accounted for nearly half the GDP growth between 2000 and 2007.2 While the growth contribution from trade has slowed during the global crisis, the linkages with the world economy remain important for Switzerland. This key role of open economy considerations is reflected in the works of Ernst Baltensperger, covering for instance the international role of the Swiss franc (Baltensperger 2012, Baltensperger and Kugler 2016) or the usefulness of a flexible exchange rate regime for keeping an independent monetary policy
Topics:
Cedric Tille considers the following as important: Featured, newsletter, Swiss Markets and News, Switzerland Exports by Sector, Switzerland Financial Account, Switzerland Gross Domestic Product, Switzerland Net Foreign Assets
This could be interesting, too:
Nachrichten Ticker - www.finanzen.ch writes Die Performance der Kryptowährungen in KW 9: Das hat sich bei Bitcoin, Ether & Co. getan
Nachrichten Ticker - www.finanzen.ch writes Wer verbirgt sich hinter der Ethereum-Technologie?
Martin Hartmann writes Eine Analyse nach den Lehren von Milton Friedman
Marc Chandler writes March 2025 Monthly
Introduction
Being a small open economy Switzerland is highly exposed to the girations of the world economy, both through international trade and financial flows. The country’s trade surplus for instance accounted for nearly half the GDP growth between 2000 and 2007.2 While the growth contribution from trade has slowed during the global crisis, the linkages with the world economy remain important for Switzerland. This key role of open economy considerations is reflected in the works of Ernst Baltensperger, covering for instance the international role of the Swiss franc (Baltensperger 2012, Baltensperger and Kugler 2016) or the usefulness of a flexible exchange rate regime for keeping an independent monetary policy stance (Baltensperger 2015, 2013).
The trade and financial linkages between Switzerland and the rest of the world have gone through substantial changes since 2008. This paper offers an overview of the main changes, stressing the following points. First, international trade flows show a growing role of international merchanting trade, reflecting Switzerland’s position as a commodity trading hub, and the chemicals sector (including the pharmaceutical industry). In addition, the weight of Europe as a destination for Swiss exports has clearly decreased. Second, international capital flows show a sharp reduction of banking flows and a rising role of reserves accumulation by the Swiss National Bank, even after the end of the exchange rate floor against the Euro in January 2015. Third, the Swiss current account surplus has not fueled an increase in the country’s net foreign assets, because of capital losses from asset prices and the strength of the Swiss franc. Finally, the role of foreign trade as an engine of growth has shrunk during the crisis, with the exception of merchanting trade. The analysis indicates that the impact of exchange rate movements on the balance of payments has likely changed. Trade flows have seen a growing share of sectors less sensitive to the exchange rate, while financial integration raised the exposure of the Swiss foreign asset position to exchange rate movements.
The rest of the paper is organized as follows. Section 2 presents the components of the current account, with section 3 focusing in more details on trade flows. International capital flows and the Swiss net foreign asset position are analyzed in section 4 and 5, respectively. Section 6 reviews the growth contribution from trade, and section 7 concludes.
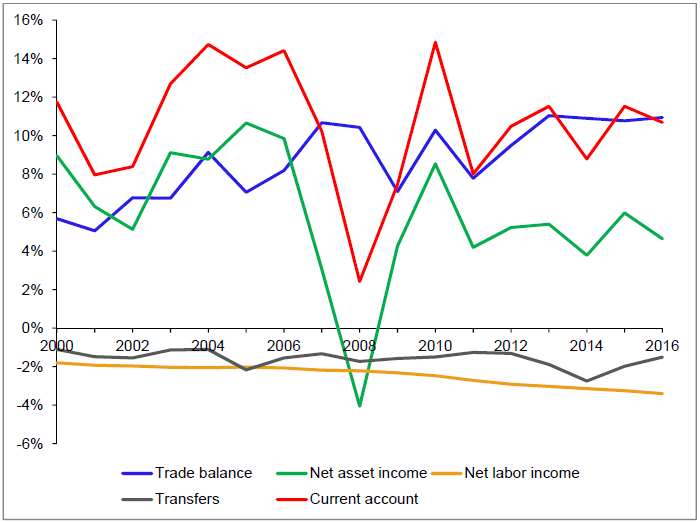
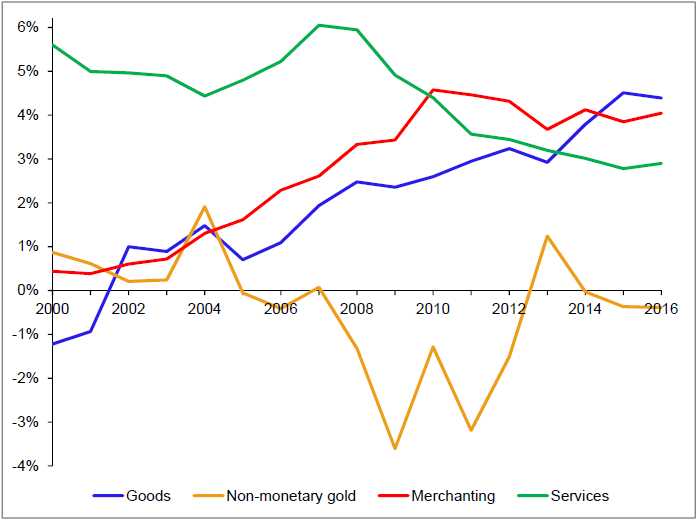
The Swiss Current AccountThis section focuses on the current account section of the balance of payments, 3 with the financial account discussed in section 4 below. The Swiss current account has shown a sizable surplus of around 10 percent of GDP for many years (figure 1, red line). This first reflects a sizable trade surplus (blue line), with a steady increase and moderate fluctuations. Switzerland’s net international creditor position also translates into a surplus in the earnings on foreign assets, net of the payments to foreign investors (green line). This net income surplus is substantial, despite a decrease owing to lower interest rates. It is also quite volatile as the earnings of Swiss firms’ foreign affiliates are sensitive to the world business cycle, in particular during the 2008 global crisis. Finally, we observe small and steady deficits in the last two components of the current account, namely the labor income earned by foreign residents working in Switzerland (orange line) and transfers to the rest of the world (grey line). It is interesting to take a closer look at the Swiss trade balance (figure 2). While one often thinks of machinery, chemicals, or financial services as the main Swiss exports, other components play a substantial role. First, Switzerland is a hub in the gold trade, not only in terms of trading but also in terms of processing and refining of the metal itself (Swiss National Bank 2014). The gold shipments entering and leaving Switzerland are recorded as “non-monetary gold” transactions in the balance of payments. While the balance of this category is on average close to zero, it can display sharp movements (orange line). In particular, the global crisis has been associated with sizable gold imports over several years. |
Switzerland Current Account(see more posts on Switzerland Current Account, ) |
| Furthermore, Switzerland is a trading hub of commodities and raw materials, especially energy products and foodstuffs. The proceeds of this trading show up as merchanting trade in the balance of payments (Swiss National Bank 2011, Beusch, Döbeli, Fischer and Yesin 2013). While the magnitude of merchanting trade was small at the beginning of the 2000’s, it subsequently increased substantially, and stabilized since the crisis (red line). The merchanting trade surplus is now similar to those of trade in services and trade in goods.
The last two components of the trade balance are more usual. Given its position as a financial and insurance center, Switzerland is a sizable exporter of services with a sizable surplus (green line). This surplus has however decreased since the 2008 crisis, a development that primarily reflects the contraction of financial services exports. While these accounted for nearly a third of all services exports in 2000, their share has since decreased to 17 percent. Finally, the balance of trade in goods shows a steady trend (blue line). While exports and imports were roughly in balance in 2000, the surplus has since increased and now amounts to 4.5 percent of GDP. The steadiness of the trend is striking as it persisted even in recent years when the Swiss franc appreciated, which appears to be at odds with the concerns expressed by export-oriented manufacturers. This puzzling pattern can be clarified by a closer look at goods exports. |
Switzerland Trade Balance(see more posts on Switzerland Trade Balance, ) |
Sectoral and geographical shifts in the trade in goodsThe data on goods trade allow us to refine the analysis along sectoral and geographic lines. The sectoral composition of exports has undergone substantial shifts (figure 3). The share of machinery, equipment and electronics (green bars) has steadily trended down. While that sector account for a third of exports in 1990, this share has shrunk to 19 percent in 2010, and has further decreased to 15 percent in 2016. The metals sector (light blue bars) has gone through a similar pattern with its share going from 9 to 6 percent. While the falling share reflected a slower growth of exports in these sectors relative to others, the situation has changed since 2008 as exports in both sectors have since contracted in absolute terms. The evolution has been more stable in two other sectors. The share of precision instruments exports (purple bars) has remained steady, despite a stagnation in absolute terms since 2008. The share of watches (red bars) shows a steady share at around 9 percent. That sector is however quite sensitive to world demand, with a sizable contraction of watches exports since 2009. By contrast, the chemicals sector accounts for a growing share of exports (dark blue bars). While it only accounted for a quarter of exports in 1990, the share of this sector has noticeably increased to 39 percent in 2010 and 45 percent in 2016. A closer look at chemicals export shows a steady pace with very little sensitivity to the world business cycle and exchange rate movements, as shown in Hanslin Grossmann, Lein and Schmidt (2016) who undertake a sector level assessment of exports sensitivity to external demand and exchange rates. If anything, exports in that sector have picked up since the abandonment of the exchange rate floor against the Euro in early 2015, with its share of exports increasing from 41 to 45 percent in just two years. The growing share of the chemicals sector in Swiss exports. Limited sensitivity to exchange rate fluctuations, raises the possibility that in the future the impact of the external value of the Swiss franc on aggregate trade flows could materially decrease. Of course, the impact on the more “traditional” export sectors would remain substantial. The rising role of chemicals could also impact the dynamics of the overall current account given the large role of research and development in that sector (Sauré 2015). |
Switzerland Export by Sector(see more posts on Switzerland Exports by Sector, ) |
| Switzerland has also diversified its exports along geographical lines (figure 4). Unsurprisingly, Europe is the largest region of destination of Swiss exports with a share of 56 percent (dark blue and red bars). This share has however been decreasing, as Europe accounted for two-thirds of Swiss exports in 1990, and 62 percent in 2010. The decrease is driven by the Euro area (dark blue bars), with exports to that region stagnating in absolute value since 2010 because of the crisis.The decrease in Europe’s weight has been offset by three regions. First, the share of Latin and (especially) North America has risen from 11 to 19 percent between 1990 and 2016 (green bars), with the increase being most pronounced since 2010. Exports towards America show a steady trend in recent years thanks to the recovery of growth in the United States and Canada. Two other regions show steadily growing shares, albeit from small values. The share of exports to the Middle East has grown from 3 percent in 1990 to 5 percent in 2016 (purple bars), while that of Asia has moved from 13 to 17 percent (orange and light blue bars). The boom of exports to Asia is driven by a growing role of China, which alone accounts for 5 percent of exports.
The geographical pattern for exports is also observed for net trade flows. While Switzerland still shows a trade deficit vis-à-vis Europe, its magnitude has been decreasing. Surpluses on the other hand have increased towards North and Latin America, the Middle East and Asia (except for China where the balance remains in deficit). While Switzerland has substantially diversified its exports market away from Europe, that region nonetheless remains a substantial trade partner for obvious geographical reasons. |
Geographical Composition of Goods Export |
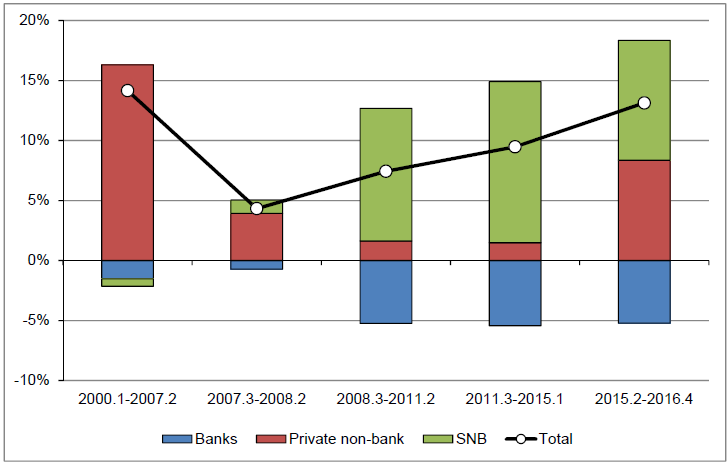
The Swiss financial accountWe now turn to the financial account, i.e. the types of assets in which Switzerland invests its current account surplus (FDI, portfolio investment, banking positions, and reserves of the Swiss National Bank). The composition of financial flows has gone through substantial changes since the beginning of the crisis. Figure 5 shows net financial outflows (purchases of foreign assets by Swiss residents net of purchases of Swiss assets by foreign residents). The total flows are depicted by the black line, which corresponds to the current account balance (up to the statistical discrepancy). Overall flows averaged 14 percent of GDP before the crisis. They The relative stability of overall net flows however hides sizable shifts in their composition, in particular regarding the role of the banking sector4 and the Swiss National Bank. Figure 5 contrasts the net ouflows linked to banks (blue bars), to private investors outside banks (red bars) and the reserve accumulation by the Swiss National Bank (green bars). Before the crisis, reserve accumulation was negligible. While Swiss banks invested substantial amounts abroad, foreign banks also invested in Switzerland, and these two flows largely offset each other. The current account surplus was then essentially funded by nonbank private investors. The financial crisis in the United States led to a first serie of changes. In the first year before the collapse of Lehman Brothers (2007 Q3 to 2008 Q2) private non-bank flows narrowed, while reserve accumulation remained minimal. The collapse of Lehman Brothers led global banks to reassess the risk on their investments and retrench to their domestic market. Not only did banks stop investing abroad, but they sold foreign investments and repatriated the funds. While this pattern occurred for both foreign and Swiss banks, it was more pronounced for Swiss banks who suffered substantial losses on the US market. The larger retrenchment by Swiss banks translated into a negative net ouflows, i.e. a flow of funds towards Switzerland. |
Switzerland Financial Account(see more posts on Switzerland Financial Account, ) |
The most acute phase of the US crisis in 2008-2009 was followed by the emergence of the Euro crisis in 2010. The net banking flows remained negative as foreign banks resumed their investments in Switzerland, while Swiss banks remained on a retrenching mode. While private non-bank flows still represented a net outflow, the magnitude was substantially reduced in the most acute phase of the crisis (2008 Q3 – 2011 Q2), so that the private balance of flows was negative (i.e. representing a net flow into Switzerland). The overall positive net outflows were thus driven solely by foreign asset purchases by the Swiss National Bank. The pattern of net banking inflows, small non-bank outflows, and reserve accumulation persisted during the period when the Swiss National Bank implemented an exchange rate floor against the Euro (2011 Q3 – 2015 Q1), as well as subsequently despite a recovery of net non-bank outflows, which still remain below their pre-crisis level.
The financial account of Switzerland shows a substantial decrease of the role of banks. This is in line with the reduced share of banking services in exports discussed above. A more detailed analysis (Auer and Tille 2016) shows that during the US crisis the retrenchment was driven by Swiss banks pulling back from the US market. In the European crisis however, the Swiss offices of foreign banks (affiliates, or Swiss banks held by foreign investors) played a larger role, allowing foreign investors to increase their Swiss franc exposure. The tensions in the Euro area raised the attractiveness of the Swiss market for safety-seeking investors (Nitschka 2016).
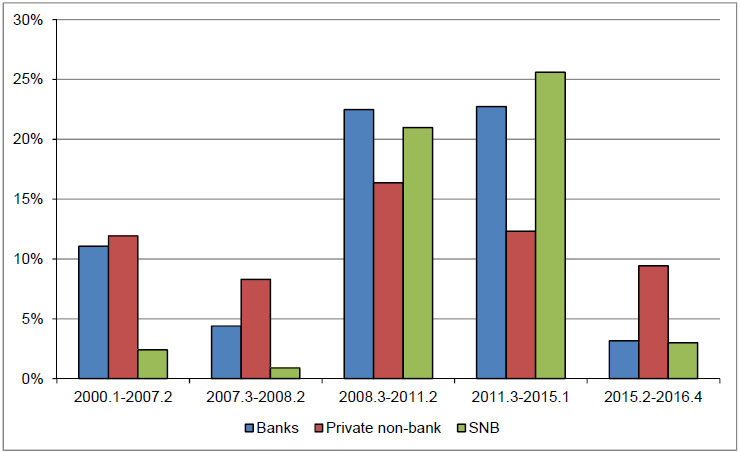
| In addition to the changes in the composition of capital flows, the crisis also affected their volatility. Yesin (2015) presents a detailed analysis of this volatility, focusing on private flows (excluding reserves accumulation) into and out of Switzerland. Before the crisis, gross inflows and outflows were highly volatile, but tended to move in step and thus net flows were more stable (for instance, quarters when Swiss banks substantially invested abroad were also quarters when foreign banks increased their Swiss exposure). The situation drastically changed in 2007. The volatility of gross inflows and outflows decreased, but they become less closely correlated, and thus the volatility of net private flows increased substantially. The Swiss financial account has thus been characterized by times of sharp (but temporary) waves of net private flows into Switzerland since 2007, which was not the case before. These waves correspond to the most acute phases of the global crisis (collapse of Lehman Brothers, periods of high stress in the Euro area) when Swiss and foreign investors sought the safety of Swiss assets. Unsurprisingly, the quarters with waves of inflows are also the times when the Swiss National Bank undertook large purchases of foreign reserves to prevent private inflows from leading to a large appreciation of the franc. Specifically, reserve accumulation was most pronounced in the spring 2010 (first phase of the Greek crisis), the summer 2011 (tensions in the United States and in the Euro area), the summer 2012 (tensions in Europe before the “whatever it takes” intervention of the European Central Bank), and the end of 2014 (pressures before the abandonment of the exchange rate floor against the Euro).
The changing volatility of net flows is illustrated by figure 6 which presents the standard deviation of net flows by categories. While net flows were steady before the crisis, and in its first year, their volatility sharply increased subsequently, including during the period when the exchange rate floor against the Euro was in place. Waves of private inflows (especially from banks) were concentrated in some quarters, and countered by reserve accumulation by the Swiss National Bank. Since the abandonment of the exchange rate floor, net private flows have stabilized, and so has the accumulation of reserves. To sum up, the financial account underwent substantial changes in the crisis, with a retrenchment of banks to the domestic market, a decrease in non-bank private flows (until recently), and a rising volatility of net private flows. These changes have led the Swiss National Bank to purchase substantial amounts of foreign assets, so much so that reserve accumulation account for the entire current account surplus since late 2008. Of course this does not imply that the current account would have been balanced in the absence of interventions by the SNB, as these interventions can induce private flows (when the SNB purchases foreign assets from Swiss banks against Swiss franc liquidity for instance). Still, it is quite possible that the current account surplus could have been lower without the interventions, and the Swiss franc stronger against other currencies. |
Switzerland Gross Domestic Product(see more posts on Switzerland Gross Domestic Product, ) |
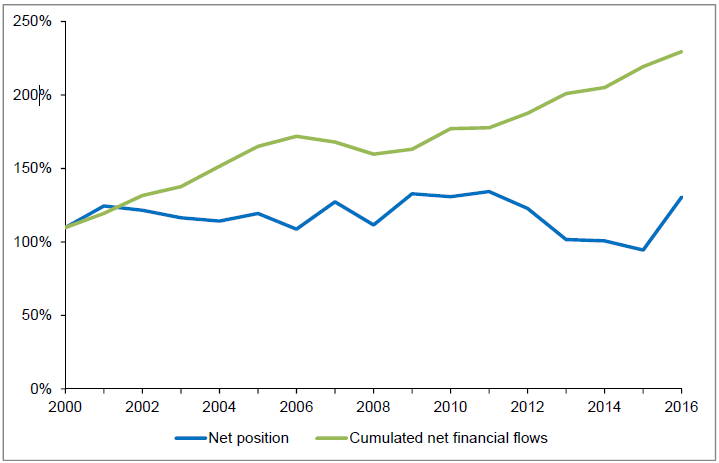
The Swiss international investment positionWhile the previous section focused on the capital flows in the financial account, we now consider the corresponding stocks of financial assets and liabilities of Switzerland vis-à-vis the rest of the world. Switzerland is a sizable creditor to the rest of the world, as can be expected given the large current account surpluses. At the end of 2016, the Swiss net international investment position (NIIP, the value of foreign assets held by Swiss residents, net of liabilities of Swiss residents to foreign investors) reached 131 percent of GDP (figure 7, black line). This is a high figure in international comparison. In addition, the NIIP has been relatively steady since 2000, with a reduction since 2012 offset by a pickup in 2016. The stability of the overall NIIP however hides some substantial shifts in its The crisis substantially affected the composition of the NIIP. First, the banking sector became a net debtor vis-à-vis the rest of the world, with its net debt now representing 50 percent of GDP. This results from the pattern of flows presented above. During the crisis, Swiss banks substantially reduced their holdings abroad, a shift that was only partially offset by a pullback of foreign banks out of Switzerland. Second, the net position of the private nonbank sector has substantially decreased during the Euro crisis, going from 123 percent of GDP |
Switzerland Net International Investment Position, 2000 - 2016 |
| The stability of the overall NIIP since 2000 is surprising at first, as Switzerland has posted sizable current account surpluses year after year. The country is thus similar to an investor that saves substantial amount but sees the value of its portfolio stagnate. The gap is of substantial magnitude. Figure 8 contrasts the NIIP (blue line, corresponding to the one in figure 7) with the value it would have reached if we simply cumulated the net financial flows starting at the NIIP of 2000 (green line). Simply cumulating flows leads to an NIIP of 230 percent of GDP. The gap between this value and the actual NIIP amounts to a sizable 99 percent of GDP. It has substantially widened since 2010, when it represented 46 percent of GDP. |
Switzerland Current Account YoY, 2000 - 2016(see more posts on Switzerland Current Account, ) |
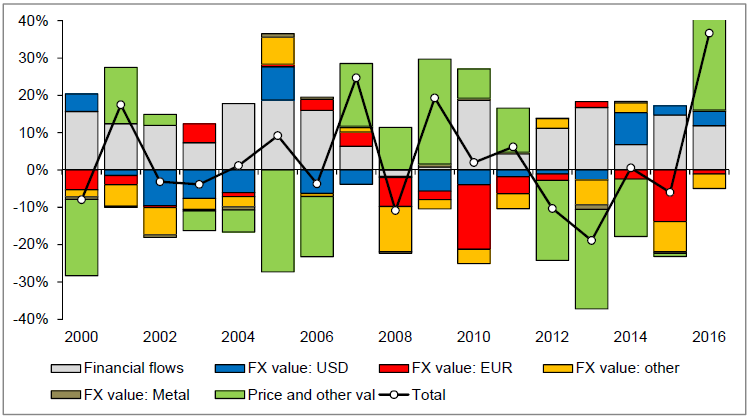
| The gap between the two lines of figure 8 occurs because financial flows are not the only driver of the NIIP. It is well known that the net position is also affected by asset prices, with higher prices on foreign assets leading to capital gains for Swiss investors for instance, and by movements in exchange rate, with an appreciation of the Swiss franc reducing the franc value of holdings denominated in foreign currencies (Tille 2012).
The magnitude of these valuation effects is especially substantial when the NIIP results from a large leverage between sizable assets and liabilities. This is indeed the case in Switzerland, as in most advanced economies. Specifically, assets held by Swiss residents abroad represent 671 percent of GDP, while claims by foreign investors on Switzerland amount to 541 percent of GDP. With this leverage, a movement in asset prices and exchange rates that affects more assets than liabilities has a sizable impact on the NIIP. Such asymmetric shifts are empirically relevant as the composition of assets differs from that of liabilities. Specifically, bonds represent a larger share of assets than of liabilities, the opposite being the case for stocks. A global increase in stock prices thus translates into a capital loss for Switzerland as it primarily raises the value of its liabilities to foreign investors. A sizable leverage also exists in terms of currencies. The data allow us to distinguish between positions denominated in Swiss francs, in foreign currencies (US dollar, Euro, and others) and in precious metals. As can be expected Switzerland is a net debtor in Swiss franc denominated holdings (286 percent of GDP) and a net creditor in foreign currency holdings (416 percent of GDP). A 5 percent appreciation of the Swiss franc then leads to a capital loss of 20.8 percent of GDP. The currency leverage of the Swiss NIIP has been increasing, as a similar appreciation would have led to a loss of 15 percent of GDP in 2010. While the SNB data do not provide a decomposition of the dynamics of the NIIP between various sources of capital gains and losses, we can compute estimates of the various effects. Figure 9 presents the change in the NIIP from one year end to another (black line). This change is decomposed between financial flows (grey bars), capital gains and losses stemming from exchange rate movements against the US dollar (blue bars), the Euro (red bars), other currencies (orange bars), the price of precious metals (dark green bars) and the residual (light green bars). This last category includes the valuation gains and losses from asset prices (in the currency of denomination) and other statistical variations. Since the beginning of the crisis the appreciation of the Swiss franc has led to sizable valuation losses, especially driven by the Euro. These were most pronounced in 2010 and following the abandonment of the exchange rate floor in 2015. Asset prices also played a substantial role with large losses in 2012-2014, partially offset by gains in 2016. To sum up, the crisis has seen a significant shift in the composition of the Swiss NIIP with a growing role of the Swiss National Bank. Fluctuations in asset prices and exchange rates have also translated into substantial losses on the Swiss portfolio which essentially offset the entire additional savings over the last sixteen years. |
Switzerland NIIP, 2000 - 2016 |
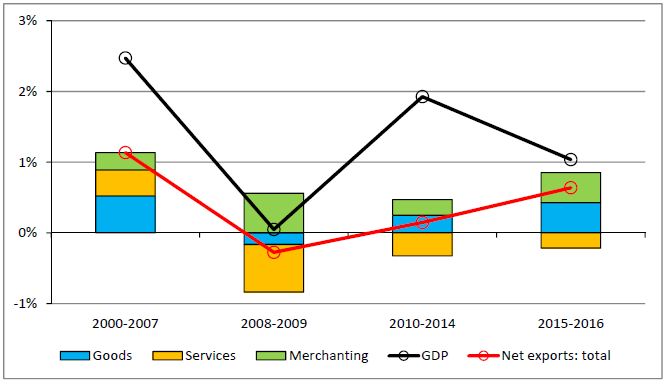
The contribution of international trade to growthOur analysis so far focused on nominal figures from the balance of payments. To gauge the impact of international linkages on growth and employment, we complete it by an assessment of the real figures. Specifically, we rely on the real trade flows (goods, services, and merchanting trade)8 from the national ccounts published by the SECO, which also include nominal figures and price deflators. Figure 10 presents the contribution of net exports (red line) to overall GDP growth (black line), and further split exports between goods (blue bars), services (orange bars) and merchanting (green bars). The years since 2000 are split into four periods: the pre-crisis years, the acute phase of the crisis with the fall of Lehman Brothers, the years of the Euro crisis, and the last two years following the abandonment of the exchange rate floor against the Euro. Before the crisis the trade surplus contributed about half the GDP growth (1.1 percentage point out of 2.5 percent), primarily thanks to surplus in goods and services. The crisis led to a substantial weakening of net exports as an engine of growth. In the acute phase of the crisis, their contribution turning negate, with the balance on services substantially turning around. By contrast, the surplus in merchanting services held well. While the Swiss economy recovered in subsequent years, this was not driven by net exports which only contributed 0.2 percentage point out of an annual growth of 1.9 percent between 2010 and 2014. While trade in goods posted a surplus again, this fell short of its value in the precrisis years. In addition, services remained in deficit, and the merchanting surplus weakened. The last two years present an interesting pattern. As one can expect, Swiss growth weakened following the sharp appreciation of the franc since the beginning of 2015. This weakness was however solely driven by the domestic economy, as the contribution of net exports actually increased to 0.6 percentage points. This pickup was driven by merchanting exports and trade in goods, itself largely driven by the chemical sector as discussed above. As merchanting and chemicals are relatively insensitive to exchange rate movements, the expected adverse impact of the exchange rate was indeed observed but in other sectors which account for a decreasing share of trade. Trade of services remained in deficit. In short, the role of international trade as an engine of growth has been reduced by the crisis, and is now more narrowly driven by specific sectors. |
Switzerland Contribution to Growth, 2000 -2016 |
Conclusion and prospects
This paper shows the substantial changes brought by the crisis to the economic linkages between Switzerland and the rest of the word. Four main points stand out. First, the composition of trade flows has changed with a rising role of merchanting and the chemicals sector, and Swiss exporters have diversified their markets beyond Europe. Second, the financial account shows the major role played by the Swiss National Bank, both in terms of flows through the accumulation of foreign reserves, and in terms of the international investment position. Third, the sizable current account surpluses of Switzerland have not translated into a higher net creditor position vis-à-vis the rest of the world, because of capital losses from fluctuations in asset prices and exchange rates. In addition, the Swiss net international investment position has become more exposed to these fluctuations. Finally, international trade does not play as large a role as an export engine as it used to, and the role has become more concentrated in some sectors, such as merchanting.
What lessons can we draw from this pattern? Two avenues for future research can be underscored, namely the impact of exchange rate movements and the role of private investors in international capital flows and holdings.
Economic analysis often focuses on the impact of exchange rates on international competitiveness and trade flows. While several export sectors are clearly impacted,9 this is much less the case for the two growing sectors in Swiss trade, namely chemicals and merchanting trade. As the share of these sectors keeps growing, Swiss international trade flows could become more resilient overall to exchange rate fluctuations. Furthermore, the decreasing role of Europe as a destination market reduces the exposure to the specific Euro-Swiss franc exchange rate. The relevance of the exchange has thus shifted from trade to financial consideration, as the exposure of the Swiss international investment position has increased, through valuation effects. Financial globalization has led to a surge in the value of both assets and liabilities in Switzerland and most other countries, and increased the sensitivity of the net position to the exchange rate as the currency composition differs between assets and liabilities.
Tags: Featured,newsletter,Switzerland Exports by Sector,Switzerland Financial Account,Switzerland Gross Domestic Product,Switzerland Net Foreign Assets

