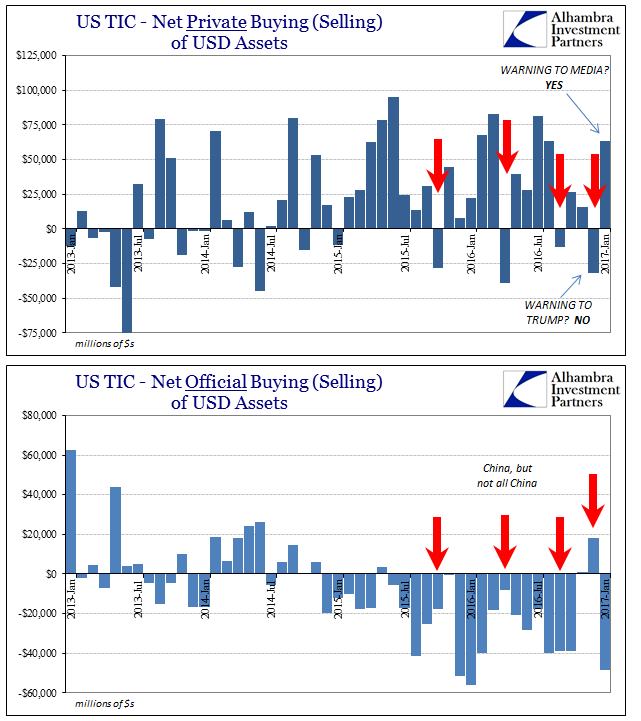
When the Treasury Department released its Treasury International Capital (TIC) data for December, what was a somewhat obscure report suddenly found mainstream attention. Private foreign investors had sold tens of billions in US securities primarily US Treasury bonds and notes which the media then made into some kind of warning to then-incoming President Trump. It was supposed to be a big deal, the kind of rebuke reserved for disreputable leaders of banana republics. The latest update instead shows that the warning was never meant for Mr. Trump at all, but rather for the media about jumping to conclusions without any depth of detail or understanding. Private offshore entities who had “sold” a net billion in UST’s in December bought back nearly billion in January. This is not an unusual occurrence in TIC data, though it fit the agenda perfectly and will likely never be corrected (or mentioned again). With the return of private inflows, including an additional net billion for equities and almost billion in agency paper, the non-official sector offered more than + billion last month. The overall total for February was but + billion, meaning that the official side was also back to normal, or what passes for it these past few years.
Topics:
Jeffrey P. Snider considers the following as important: bank balance sheet capacity, Central Banks, China, dealers, Deposits, depression, Dollar, economy, eurodollar standard, eurodollar system, Featured, Federal Reserve/Monetary Policy, Japan, Markets, money dealing, newsletter, The United States, tic, wholesale finance, Yen, Yuan
This could be interesting, too:
Nachrichten Ticker - www.finanzen.ch writes Die Performance der Kryptowährungen in KW 9: Das hat sich bei Bitcoin, Ether & Co. getan
Nachrichten Ticker - www.finanzen.ch writes Wer verbirgt sich hinter der Ethereum-Technologie?
Martin Hartmann writes Eine Analyse nach den Lehren von Milton Friedman
Marc Chandler writes March 2025 Monthly
| When the Treasury Department released its Treasury International Capital (TIC) data for December, what was a somewhat obscure report suddenly found mainstream attention. Private foreign investors had sold tens of billions in US securities primarily US Treasury bonds and notes which the media then made into some kind of warning to then-incoming President Trump. It was supposed to be a big deal, the kind of rebuke reserved for disreputable leaders of banana republics.
The latest update instead shows that the warning was never meant for Mr. Trump at all, but rather for the media about jumping to conclusions without any depth of detail or understanding. Private offshore entities who had “sold” a net $40 billion in UST’s in December bought back nearly $38 billion in January. This is not an unusual occurrence in TIC data, though it fit the agenda perfectly and will likely never be corrected (or mentioned again). With the return of private inflows, including an additional net $16 billion for equities and almost $14 billion in agency paper, the non-official sector offered more than +$60 billion last month. The overall total for February was but +$15 billion, meaning that the official side was also back to normal, or what passes for it these past few years. Because of the liquidation on the private side in December, foreign central banks and government entities took a breather on filling in the “dollar” funding gap; purchasing, on net, $18 billion. In January, without the aid of further private bond liquidations, official activity once more turned drastically negative. |
|
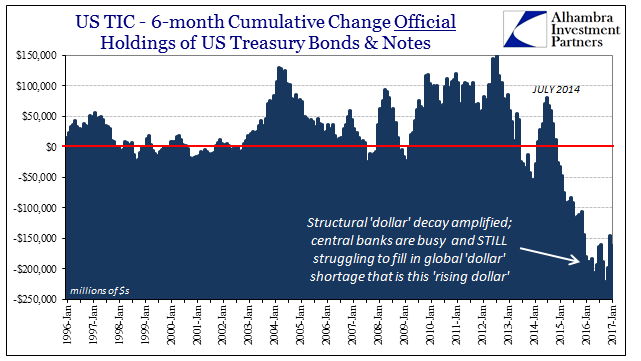
| Total activity amounted to -$48.7 billion in January, including a net -$44.8 billion in official UST holdings. We don’t know exactly who was doing all the selling, this bypass “dollar” funding. It remains unclear for there was yet another discrepancy between the main data set (which shows -$44.8 billion in net official UST) and the country-specific breakdown (which shows +$13.4 billion in net official UST). |
US TIC 1996-2017 |
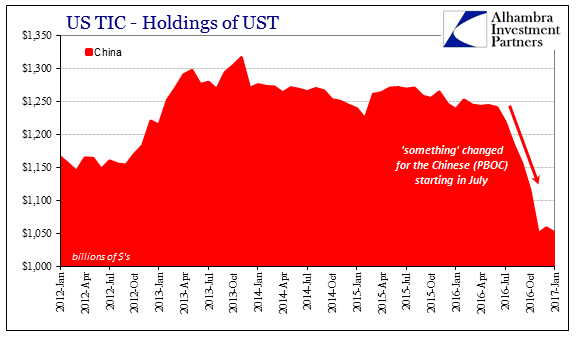
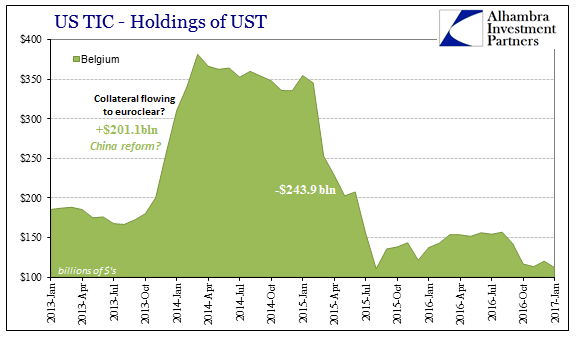
| We know it wasn’t likely the Chinese if it occurred. Forex data tabulated by China reported for January just over a $12 billion reduction in official forex holdings, of which some major part was surely denominated in dollars. The TIC breakout by country estimates a $7 billion decline augmented by some of Belgium’s $8 billion decrease, leaving the two perspectives largely in agreement. Who, then, was left to face the “dollar”? |
US TIC - Holdings of UST China 2012-2017 |
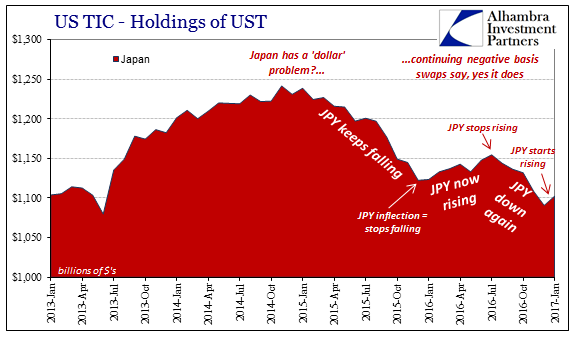
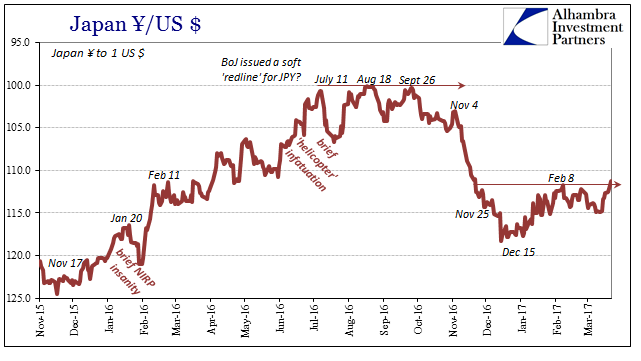
| It wasn’t Japan, or at least not in the way the rest of the world’s currencies are oriented toward it. The reported Japanese holdings of UST’s (official) increased in January, which counterintuitively matches perfectly the pattern in JPY dating back to early 2015. |
US TIC - Holdings of UST Belgium 2013-2017 |
| The level of Japanese UST’s moves inversely to the way it works out in places like China – Japan “sells UST’s” to keep JPY going lower against the dollar, and when it doesn’t (forced accumulation) JPY is almost guaranteed to be rising just as it was in January. The mechanics that govern this relationship relate to the differences of FX “currency” versus other forms (and are a topic for another day). |
US TIC - Holdings of UST Japan 2013-2017 |
Japan Yen / US Dollar(see more posts on USD/JPY, ) |
|
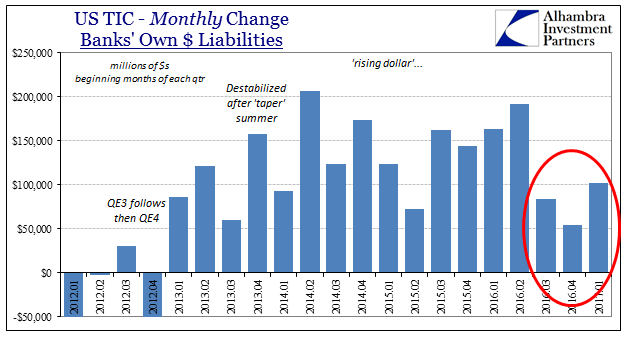
| Reported bank liabilities grew by $102 billion in January, which leads our interpretation toward a bit of quandary. It has been normal for these categories of cross border dollar flows (deposits, mostly) to rise in the month beginning each quarter. However, to start both the past two quarters the increase was unusually small. At $102 billion for Q1 2017, the result is partway between both of those prior and what had been typical (with it leaning more toward the unfamiliar than familiar). |
US TIC - Banks Own Dollar Liabilities |
| It seems increasingly likely that the difference shown above may be related to the liquidations in UST’s which may have had the effect of reducing outstanding liabilities and therefore funding requirements (leaving the official sector having to do less). It is unclear for now exactly how to interpret the bank data, but hopefully subsequent months will clear up the matter.
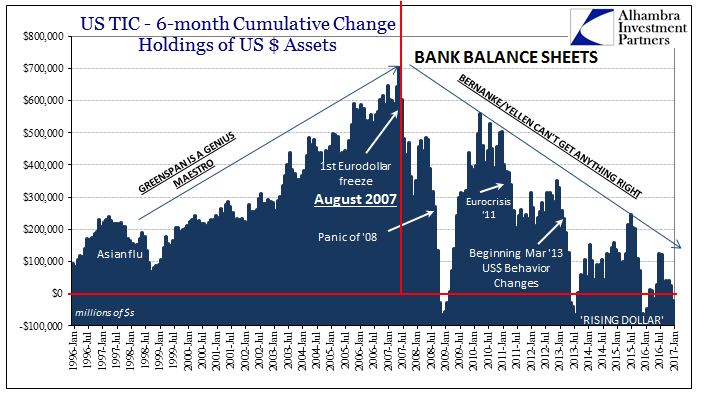
Regardless, there was never a warning to Trump in the data, a preposterous assumption made from an agenda not rational analysis. The latter leads us in the direction of a chronic “dollar” sometimes rising. As I wrote last month:
And, unsurprisingly, they are still selling. |
US TIC - Bank Balance Sheets 1996-2017 |
Tags: bank balance sheet capacity,central banks,China,dealers,Deposits,depression,dollar,economy,eurodollar standard,eurodollar system,Featured,Federal Reserve/Monetary Policy,Japan,Markets,money dealing,newsletter,tic,wholesale finance,Yen,yuan

