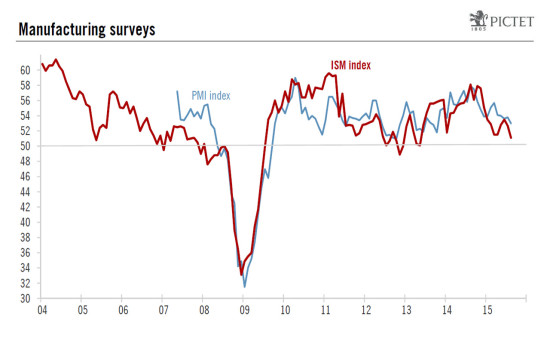
The ISM Manufacturing index continued to fall in August, whereas its Non- Manufacturing ounterpart remained pitched at historically very high levels. Taken together, recent indices point towards economic growth running above 4% in July-August. We continue to expect growth to prove robust in H2 2015. The ISM Manufacturing index fell further in August The ISM Manufacturing survey for August 2015 was published on Tuesday this week. The headline reading dipped further from 52.7 in July to 51.1 in August, falling short of consensus expectations (52.5). This yardstick is back to its lowest level since May 2013. As it is, the Markit Manufacturing PMI (reflecting results from the other main survey on manufacturing activity) remains above its ISM counterpart. It moved down modestly from 53.8 in July to 53.0 in August (see chart above). The details of the ISM report do not offer much more encouragement. The three most important sub-indices – Employment, Production and New Orders – declined noticeably m-o-m. The fall in the New Orders sub-index was particularly striking, as it plunged from 56.5 in July to 51.7 in August. This index is the most forward-looking component of the survey.
Topics:
Bernard Lambert considers the following as important: Macroview, Uncategorized
This could be interesting, too:
Claudio Grass writes The Case Against Fordism
Claudio Grass writes “Does The West Have Any Hope? What Can We All Do?”
Claudio Grass writes Predictions vs. Convictions
Claudio Grass writes Swissgrams: the natural progression of the Krugerrand in the digital age
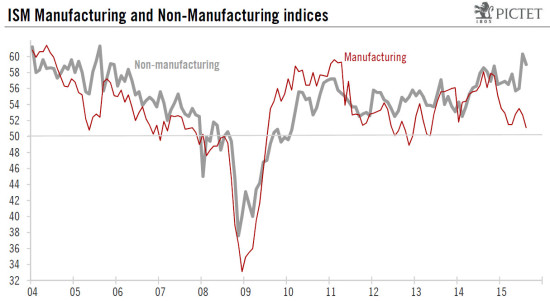
The ISM Manufacturing index continued to fall in August, whereas its Non- Manufacturing ounterpart remained pitched at historically very high levels.
Taken together, recent indices point towards economic growth running above 4% in July-August. We continue to expect growth to prove robust in H2 2015.
The ISM Manufacturing index fell further in August
The ISM Manufacturing survey for August 2015 was published on Tuesday this week. The headline reading dipped further from 52.7 in July to 51.1 in August, falling short of consensus expectations (52.5). This yardstick is back to its lowest level since May 2013. As it is, the Markit Manufacturing PMI (reflecting results from the other main survey on manufacturing activity) remains above its ISM counterpart. It moved down modestly from 53.8 in July to 53.0 in August (see chart above).
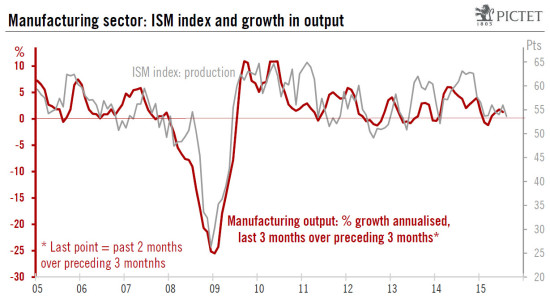
The details of the ISM report do not offer much more encouragement. The three most important sub-indices – Employment, Production and New Orders – declined noticeably m-o-m. The fall in the New Orders sub-index was particularly striking, as it plunged from 56.5 in July to 51.7 in August. This index is the most forward-looking component of the survey.
In any event, although we are rather optimistic about overall economic growth, the combined effect of lower oil prices, soft foreign demand and a higher dollar is a clear sharp negative factor for the manufacturing sector which is much more dependent on exports and the oil-extraction sector than the whole services-orientated economy.
ISM Non-Manufacturing index remained at a high level
The ISM Non-Manufacturing survey was published today. Unlike its Manufacturing counterpart, the composite Non-Manufacturing index remained at elevated levels. Admittedly, it did drop back from 60.3 in July to 59.0 in August, but the level reached back in July was the highest for a decade. If we set July’s reading to one side, this yardstick in August would also have been at its highest level for any month since 2005. Consensus estimates had been looking for a lower level of 58.2. Most sub-indices did fall back somewhat m-o-m in August, but they remain at historically high levels. This was notably the case for the New Orders sub-index which eased back by a modest 0.4 of a point m-o-m to 63.4, still a very high reading.
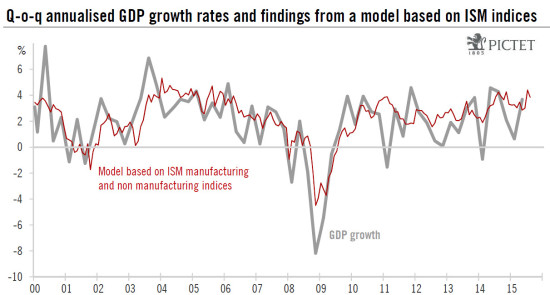
Taken together, the two ISM composite indices suggest that overall economic growth has remained quite buoyant so far in Q3. If we use historical correspondence to seek to calibrate what the ISM indices are pointing towards in terms of GDP growth (see chart on next page), we arrive at 3.8% in August and 4.1% on average for July and August, following averages of 3.1% in Q2 and 3.2% in Q1. The July-August ISM surveys, therefore, suggest that the economy has expanded very robustly so far in Q3. Nevertheless, although ISM surveys are timely and useful indicators of the strength in the economy, they are not very reliable at forecasting GDP growth in the short run. Indeed, as we have seen above, ISM indices had been pointing to 3.2% GDP growth in Q1 2015 whereas the last estimate for this was 0.6%.
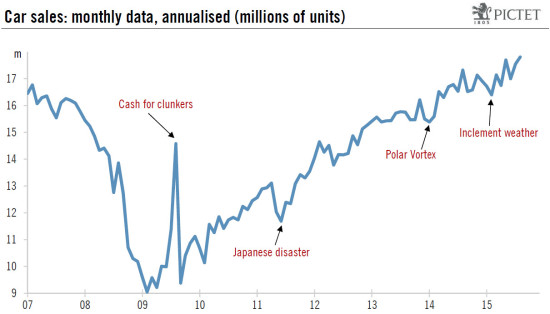
In any event, the high levels recorded by the Non-Manufacturing index in July-August are quite encouraging for the economy in Q3. It is also worth noting that several statistics published over the past few days (car sales, construction spending, trade balance) have also been quite upbeat. This was notably the case for car sales (see chart below), which rose by 1.5% m-o-m in August to a new cycle-high of 17.8 million units (annualised). As a result, between Q2 and July-August, car sales rose by a strong 15.7% annualised, after +9.8% q-o-q in Q2. This lends further support to our view that growth in consumer spending will settle at around a robust 3.0% q-o-q annualised in Q3, after +3.1% in Q2.
Regarding GDP itself, we continue to expect q-o-q annualised growth to average 2.7% in H2 2015 (2.5% in Q3 and 2.9% in Q4).

