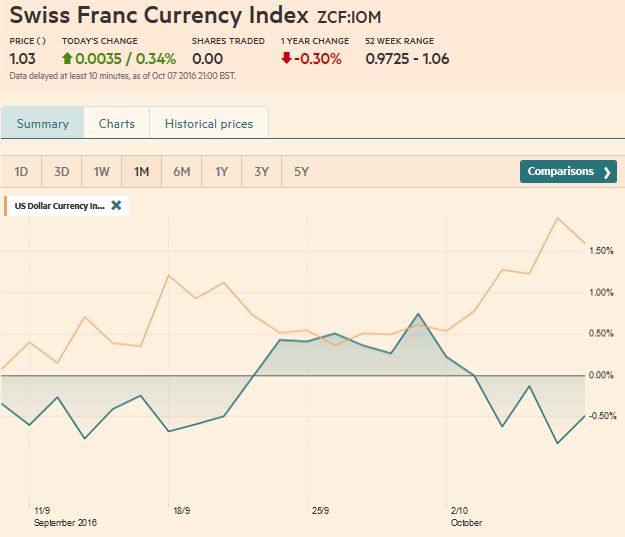
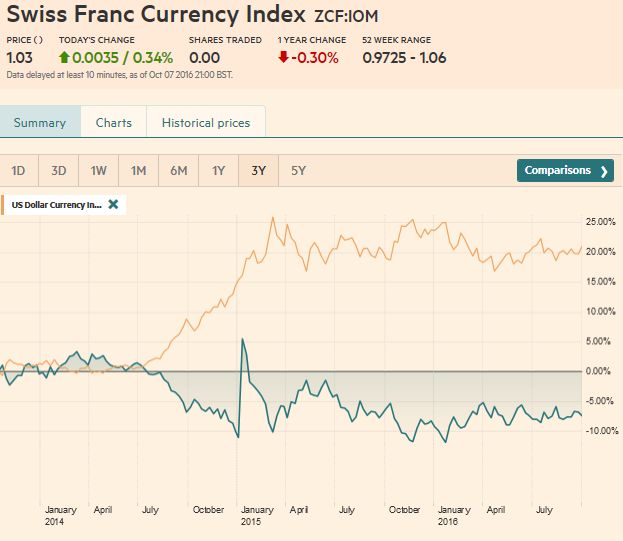
Swiss Franc Currency Index The Franc index lost considerably in the last week, in particularly in comparison to the dollar index. Reason was the exceptionally strong U.S. ISM Non-Manufacturing Index. Marc Chandler speaks about the jobs report that is rather a lagging indicator, but I like to focus on the leading index., the ISM.My view is confirmed by the stronger dollar that reflect the ISM index, but not the mediocre job figures. Trade-weighted index Swiss Franc 1 Month(see more posts on Swiss Franc Index, ) - Click to enlarge Swiss Franc Currency Index (3 years) The Swiss Franc index is the trade-weighted currency performance (see the currency basket) On a three years interval, the Swiss Franc had a weak performance. The dollar index was far stronger. The dollar makes up 33% of the SNB portfolio and 25% of Swiss exports (incl. countries like China or Arab countries that use the dollar for exchanges). Contrary to popular believe, the CHF index gained only 1.73% in 2015. It lost 9.52% in 2014., when the dollar (and yuan) strongly improved. Swiss Franc Currency Index(see more posts on Swiss Franc Index, )Swiss Franc Currency Index October 08, 2016 - Click to enlarge USD/CHF The US dollar finished September in a weak technical position.
Topics:
George Dorgan considers the following as important: Australian Dollar, Canadian Dollar, Crude Oil, EUR/CHF, Euro, Euro Dollar, Featured, FX Trends, Japanese Yen, MACDs, newslettersent, S&P 500 Index, Swiss Franc Index, U.S. Treasuries, US Dollar Index, USD/CHF, USDJPY
This could be interesting, too:
Nachrichten Ticker - www.finanzen.ch writes Die Performance der Kryptowährungen in KW 9: Das hat sich bei Bitcoin, Ether & Co. getan
Nachrichten Ticker - www.finanzen.ch writes Wer verbirgt sich hinter der Ethereum-Technologie?
Marc Chandler writes March 2025 Monthly
Mark Thornton writes Is Amazon a Union-Busting Leviathan?
Swiss Franc Currency IndexThe Franc index lost considerably in the last week, in particularly in comparison to the dollar index. Reason was the exceptionally strong U.S. ISM Non-Manufacturing Index. Marc Chandler speaks about the jobs report that is rather a lagging indicator, but I like to focus on the leading index., the ISM. |
Trade-weighted index Swiss Franc 1 Month(see more posts on Swiss Franc Index, ) |
Swiss Franc Currency Index (3 years)The Swiss Franc index is the trade-weighted currency performance (see the currency basket)On a three years interval, the Swiss Franc had a weak performance. The dollar index was far stronger. The dollar makes up 33% of the SNB portfolio and 25% of Swiss exports (incl. countries like China or Arab countries that use the dollar for exchanges). Contrary to popular believe, the CHF index gained only 1.73% in 2015. It lost 9.52% in 2014., when the dollar (and yuan) strongly improved. |
Swiss Franc Currency Index(see more posts on Swiss Franc Index, ) |
USD/CHF
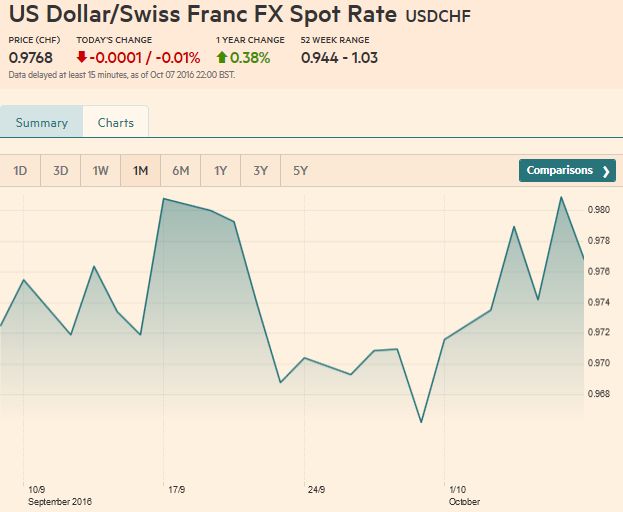
The US dollar finished September in a weak technical position. However, the fundamental news, including mostly upside surprises from the economic data, and even some doves on the Federal Reserve, like Chicago President Evans seemed to warm to a year-end hike and lifted the dollar. The less than spectacular jobs report saw the dollar give back some of this week’s gains. It still managed to close higher against all of them, though with the momentum stalling ahead of the weekend.
We have consistently argued against the speculation of a November move. There is no precedent for a change in policy so close to a national election. That is one way the Fed has shown its independence from politics. It will not overshadow the political process. Also, the November meeting does not have a press conference; nor is there a scheduled press conference or updated forecasts. These are not insurmountable hurdles, but it would seem to require a greater sense of urgency than is current expressed or embedded in the data.
The US jobs data was solid even if disappointing. The private sector gained 167k jobs, more than August’s 144k increase, and a little more than the 153k average jobs creation over the past six months. The 11k government jobs lost was the most in the year, while the participation rate rose to 62.9%, matching the highest level since February 2014.
|
US Dollar - Swiss Franc FX Spot Rate(see more posts on USD/CHF, ) |
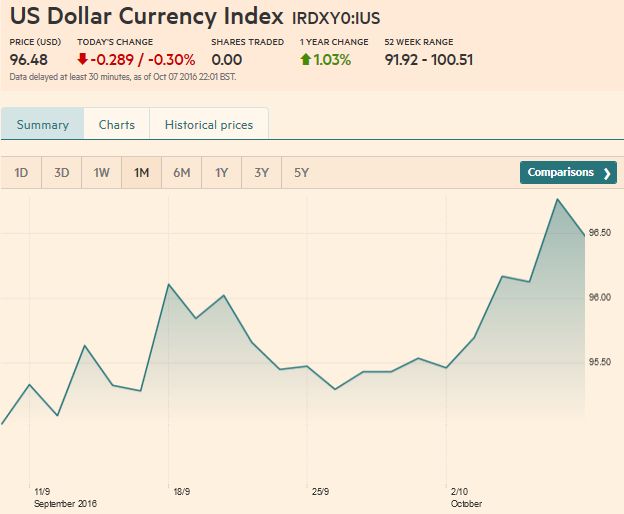
US Dollar IndexBefore the jobs report, the Dollar Index
rose to almost 97.20, the highest since late-July. Note that the top of the Bollinger Band was near 96.55. The jobs data sent the Dollar Index to 96.40. That met the 38.2% retracement objective (~96.50) of the rally from the September 30 low near 95.35. The 50% retracement is at 96.25 (which corresponds to the five-day moving average). The 61.8% retracement is 96.05. |
US Dollar Currency Index(see more posts on Dollar Index, ) |
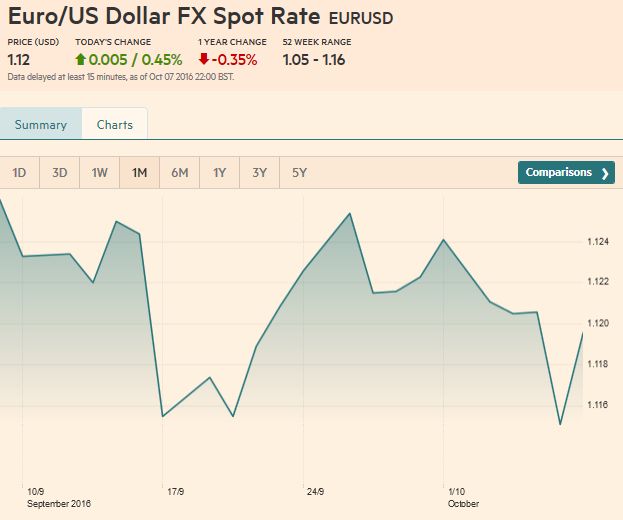
EUR/USDThe euro had fallen to two-month lows near Those extremes, $1.11 on the downside and $1.1250 may denote the range for period ahead. We expect policy for the ECB and the Federal Reserve are on hold until December. |
Euro/US Dollar FX Spot Rate(see more posts on Euro Dollar, ) |
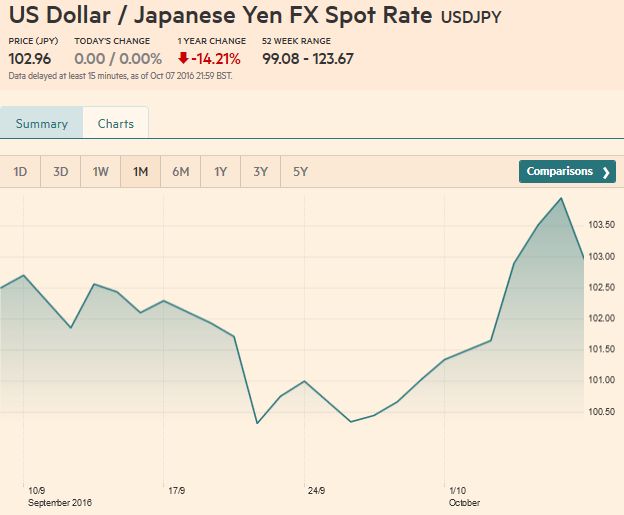
USD/JPYThe dollar’s eight-session advance against the yen ended |
US Dollar Japanese Yen FX Spot Rate(see more posts on USDJPY, ) |
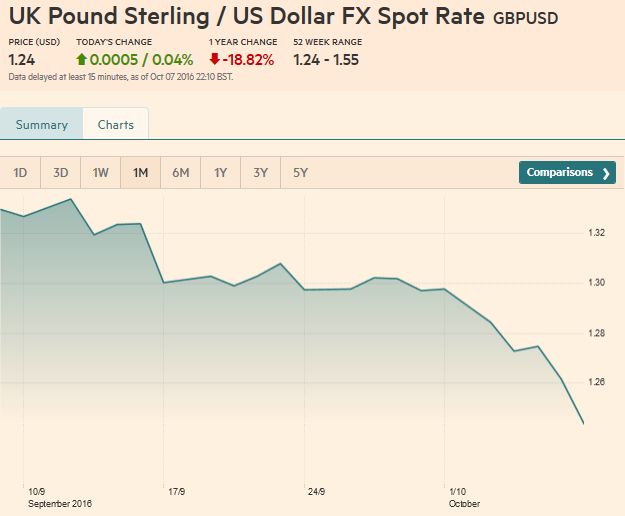
GBP/USDSterling collapsed before the weekend but managed to recover toward $1.25. After losing 1.25% in the month of September, sterling depreciated by 4% last week, The risks of a hard exit from the EU, which has come to mean the lack of free access to the single market in exchange for more controls over immigration, have risen, but that does not explain what was as much as a 10% move in few minutes. The drop was not as large as the one that took place in the immediate response to the referendum, but there are few precedents of such a large move without a clear precipitating factor. Our usual technical tools may be of little help, but we suspect |
UK Pound Sterling / US Dollar FX Spot Rate(see more posts on British Pound, ) |
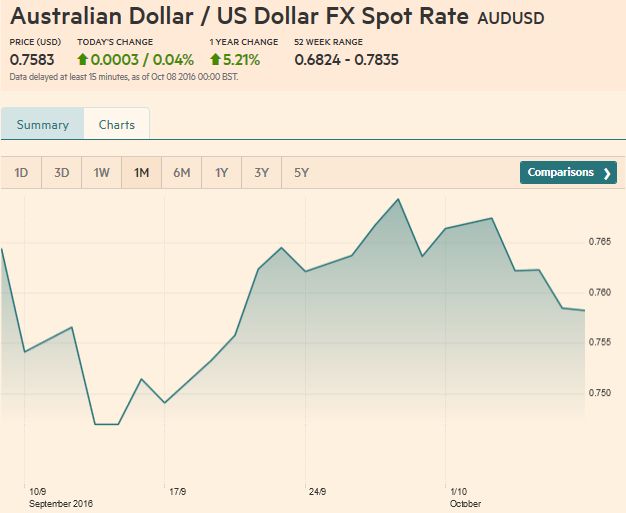
AUD/USDThe Australian dollar’s technical tone has softened, with the RSI and MACDs moving lower. The five-day moving average could slip below the 20-day average next week. The $0.7700 area has proved to be a formidable cap. The third test in three months failed to break the ceiling. A retracement objective near $0.7570 has been frayed but not convincingly violated. Even then, a break of $0.7540 may be needed to signal a retest on the early-September lows a cent lower. |
AUD/USD FX Rate Chart(see more posts on Australian Dollar, ) |
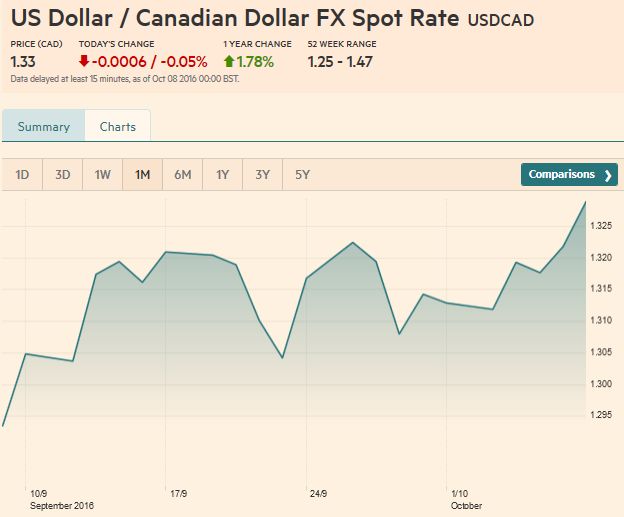
USD/CADThe Canadian jobs report was better than the US, but the rate differential story still is operative, and that, arguably, helped keep the US dollar well supported. The US dollar closed the week recording four consecutive sessions of higher lows and higher highs. The greenback is testing the CAD1.33 level. It marks a 38.2% retracement of the dollar’s sell-off since approaching CAD1.47 at the end of January. It has not been above there since early-March. A move above there would bring the next objective (~CAD1.3575) into view. A shelf appears carved near CAD1.30. |
USD/CAD FX Rate Chart(see more posts on Canadian Dollar, ) |
Crude Oil
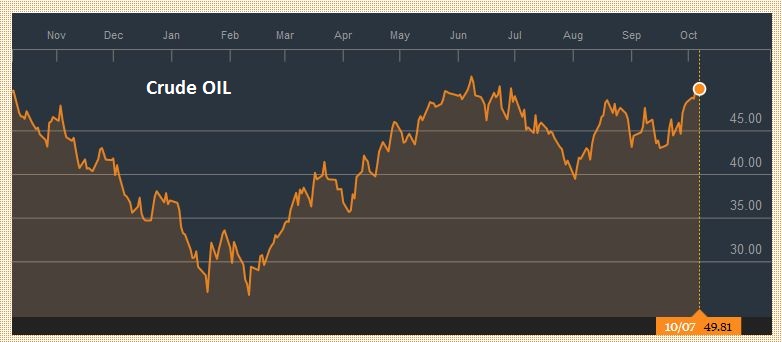
The bullish oil story is predicated on an OPEC agreement to curb output and a dramatic decline in the US oil stocks.
We are skeptical. There remains such a fundamental disagreement between Saudi Arabia and Iran that they don’t even agree on the current output. The details of last month’s agreement will not be decided until next month. The drawdown in US inventories may be related to a pending storm. Nevertheless, the November contract
closed above $50 a barrel for the first time since early July. The rally over the past week or so has climbed the five-day moving average, which finished the week near $49.60. That may offer nearby support, and below there is $48. On the upside, $52 is the next target for the bulls.
|
Crude Oil Chart(see more posts on Crude Oil, ) |
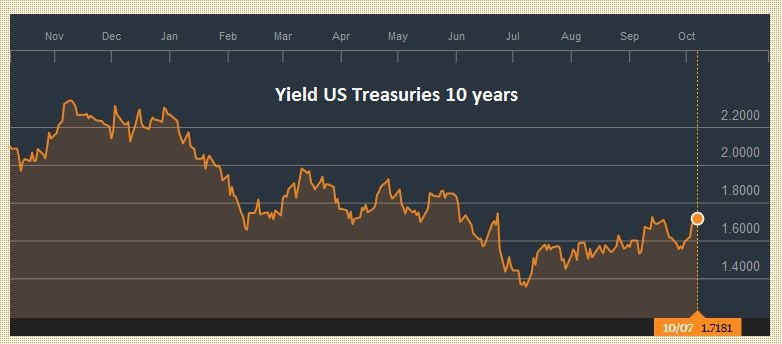
U.S. TreasuriesOur fundamental work has shown that the foreign exchange market appears to have become more sensitive to interest rate developments. US interest rates had risen ahead of the jobs report, and whatever disappointment there was with the data, interest rates did not pullback. The US 10-year yield is near a four-month high 1.75%, having risen for six consecutive sessions. The 2-year yield has a We expect a consolidative period. |
Yield US Treasuries 10 years(see more posts on U.S. Treasuries, ) |
S&P 500 Index
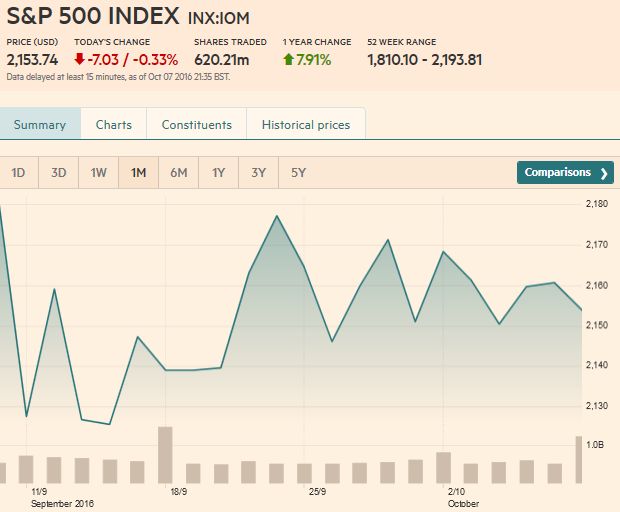
The S&P 500 posted an outside down day ahead of the weekend, creating a vulnerable tone to start the new week, which features the formal start of the earnings season. US companies suspend stock buyback programs around their earnings reports.
Technical indicators underscore the vulnerability of the S&P 500. Initial support is seen ahead of 2140. A break warns of a test on last month’s low, set near 2119.
|
S&P 500 Index(see more posts on S&P 500 Index, ) |

