The Dollar Index made a marginal new high for the year at the end of June a touch below 95.55. It fell through the start of this week when it reached nearly 93.70. With the earlier gains, the Dollar Index briefly traded above the 61.8% retracement of the pullback (~94.85). A move now below 94.20 would be disappointing. The Dollar Index is not a trade-weighted. It is too concentrated in Europe and does not include two of the US top four trading partners Mexico and China. It does not appear to be used by corporates or many asset managers, like mutual funds, insurance companies, and endowments. It is primarily a speculative vehicle. Euro-dollar is the most important and most traded currency pair. The euro rallied
Topics:
Marc Chandler considers the following as important: 4) FX Trends, EUR, Featured, Great Graphic, JPY, newsletter, USD
This could be interesting, too:
Nachrichten Ticker - www.finanzen.ch writes Die Performance der Kryptowährungen in KW 9: Das hat sich bei Bitcoin, Ether & Co. getan
Nachrichten Ticker - www.finanzen.ch writes Wer verbirgt sich hinter der Ethereum-Technologie?
Martin Hartmann writes Eine Analyse nach den Lehren von Milton Friedman
Marc Chandler writes March 2025 Monthly
The Dollar Index made a marginal new high for the year at the end of June a touch below 95.55. It fell through the start of this week when it reached nearly 93.70. With the earlier gains, the Dollar Index briefly traded above the 61.8% retracement of the pullback (~94.85). A move now below 94.20 would be disappointing.
The Dollar Index is not a trade-weighted. It is too concentrated in Europe and does not include two of the US top four trading partners Mexico and China. It does not appear to be used by corporates or many asset managers, like mutual funds, insurance companies, and endowments. It is primarily a speculative vehicle.
|
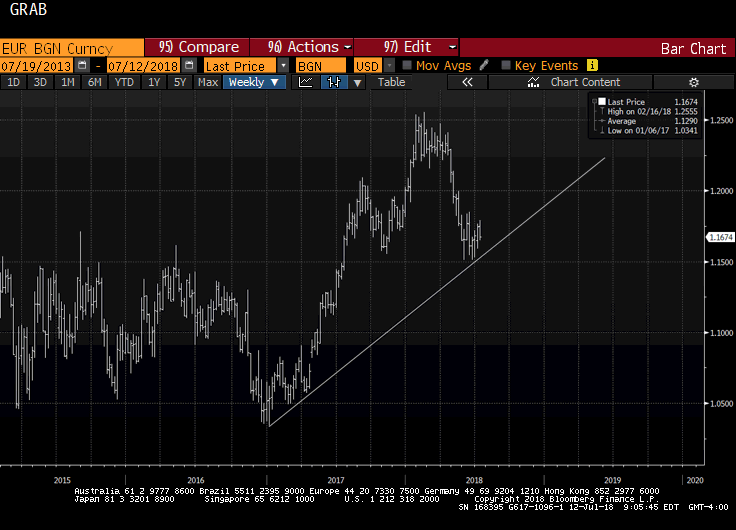
Euro-dollar is the most important and most traded currency pair. The euro rallied strongly last year. The move was marked by a gap higher in April 2017 after it became clear that the populist-nationalist wave that ostensibly swept the UK out of EU and Trump into the White House was not going to spread to the Netherlands and France. Stronger European growth also helped fuel a change in sentiment. However, after a strong start to the year, the euro has retreated. Economic data has disappointed. The US continues to raise rates and the interest rate differential widened. US economic data has mostly surprised on the upside. The US policy mix of tighter monetary and looser fiscal is associated with currency appreciation. As this Great Graphic shows, the euro has fallen to a trend line drawn off the cyclical low in early 2017. That trend line came in near $1.15 at the end of June. It will be closer to $1.1550 by the end next week. The 50% retracement of the euro’s recovery into the start of this year is found near $1.1450. The 61.8% retracement is a little below $1.12. The euro has been chopping in its trough about $1.15 since last May. It has not been above $1.1850, which corresponds to the 38.2% retracement of the euro’s decline since April 19, when it last traded $1.24. The 50% retracement is near $1.1950. |
EUR BGN Curncy 2013-2018 |
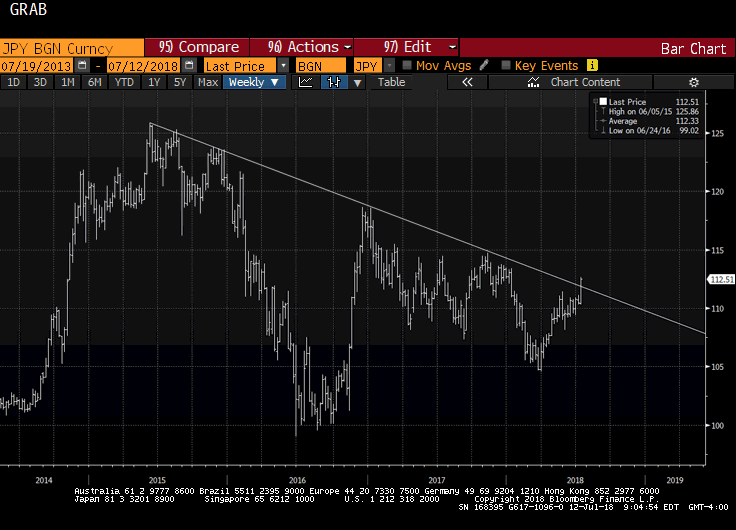
| The yen is a different kettle of fish. The yen has broken down this week. As this second Great Graphic shows, the dollar has bolted through a three-year downtrend. The trend line comes in near JPY111.60 this week. The slope is around 10 ticks a week.
The next technical target is near JPY113.25, which is the 61.8% retracement of the dollar’s decline since the start of last year. It also corresponds to the 200-day moving average. Above there is psychological round number of JPY114.00. The high from H2 17 is near JPY114.75. It is not yet clear what triggered the yen’s slide. The usual suspects like the 10-year interest rate differential are not convincing. The US premium peaked in May over 300 bp. Today it is at 280 bp. The two-year rate differential has held in better at is within spitting distance of the mid-May high a little below 272 bp. US stocks are firm, even if choppy and the S&P 500 is still within striking distance of the 2800 cap that has checked advances since February’s swoon. Higher oil prices and stronger wage growth in Japan has thus far not sparked inflation or boosted consumption. Japanese investors do appear to have stepped up their purchases of foreign assets. Consider that the four-week average of Japanese foreign bond purchases stands at JPY516 bln is the most since last August. Japanese investors have also increased their purchases of foreign equities. The four-week moving average of JPY446 bln in more than three years. |
JPY BGN Curncy 2013-2018 |
Tags: #USD,$EUR,$JPY,Featured,Great Graphic,newsletter


