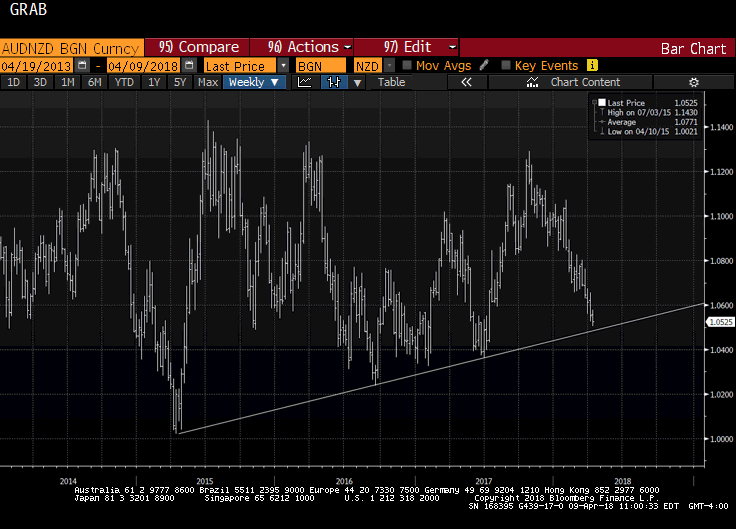
Today is the fifth consecutive session that the Australian dollar has weakened against the New Zealand dollar. It has now fallen to test a three-year old trendline that we show on the Great Graphic, composed on Bloomberg. The last leg down in the Aussie actually began last October, and through today’s low, it is off by a little more than 7%. In fairness, it has really been in a broad range fro several years, roughly NZD1.03 to NZD1.14, and mostly NZD1.05-NZD1.10. The trendline comes in now near NZD1.0445. The technical indicators on the daily bar charts are not generating strong signals that a bottom is at hand. The RSI is at new lows since February 21. The MACDs have not been above since last November and are also
Topics:
Marc Chandler considers the following as important: 4) FX Trends, AUD, Featured, Great Graphic, newslettersent, NZD
This could be interesting, too:
Nachrichten Ticker - www.finanzen.ch writes Die Performance der Kryptowährungen in KW 9: Das hat sich bei Bitcoin, Ether & Co. getan
Nachrichten Ticker - www.finanzen.ch writes Wer verbirgt sich hinter der Ethereum-Technologie?
Marc Chandler writes March 2025 Monthly
Mark Thornton writes Is Amazon a Union-Busting Leviathan?
| Today is the fifth consecutive session that the Australian dollar has weakened against the New Zealand dollar. It has now fallen to test a three-year old trendline that we show on the Great Graphic, composed on Bloomberg.
The last leg down in the Aussie actually began last October, and through today’s low, it is off by a little more than 7%. In fairness, it has really been in a broad range fro several years, roughly NZD1.03 to NZD1.14, and mostly NZD1.05-NZD1.10. The trendline comes in now near NZD1.0445. The technical indicators on the daily bar charts are not generating strong signals that a bottom is at hand. The RSI is at new lows since February 21. The MACDs have not been above since last November and are also at there lowest levels since late February. The Slow Stochasitcs put in a low in late March but are still in the trough. Some observers are concluding that New Zealand is less exposed than Australia to a trade war. In the CME futures, we note that the net speculative position is now net short the Aussie and net long Kiwi, but the positions are small. However, we suspect that the logic is post-hoc in the sense that the cross was already moving against the Aussie long before the trade tensions escalated. And one of the big knocks against the Aussie is that its curve is below the US. The same can be said for New Zealand. |
AUD/NZD, 2014 - 2018 |
Tags: $AUD,Featured,Great Graphic,newslettersent,NZD

