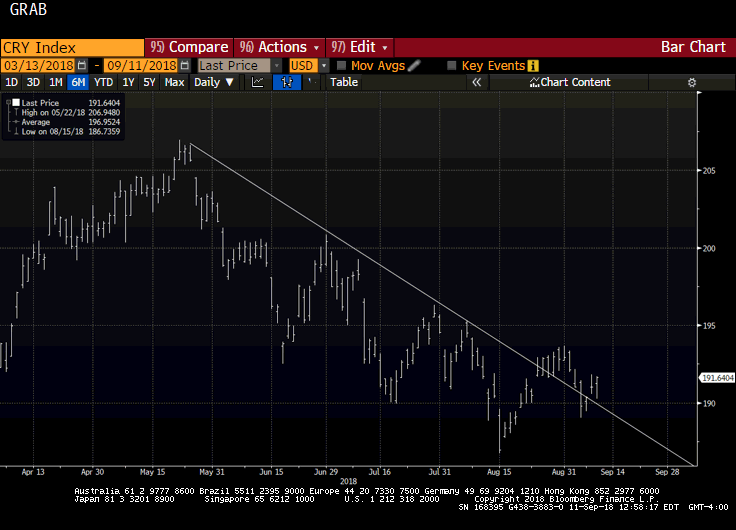
The CRB index has been trending lower since late May. It fell nearly 10% to retrace 50% of the rally come June 2017. This Great Graphic shows the 4 1/2 month trendline. It had been violated in late August but fell back under it at the end of last week. On Monday, it gapped higher, above the trendline. Today it filled the gap and rallied to new session highs. A move above 192.00 would likely confirm a bottom of some importance is in place. The technical readings on the weekly bar charts are more constructive than the dailies. The commodities in the basket are mostly traded in US dollars. Typically, then when the dollar is strong, one generally expects lower commodity prices and vice versa. On a purely directional
Topics:
Marc Chandler considers the following as important: 4) FX Trends, DXY, Featured, Great Graphic, newsletter, USD
This could be interesting, too:
Nachrichten Ticker - www.finanzen.ch writes Die Performance der Kryptowährungen in KW 9: Das hat sich bei Bitcoin, Ether & Co. getan
Nachrichten Ticker - www.finanzen.ch writes Wer verbirgt sich hinter der Ethereum-Technologie?
Martin Hartmann writes Eine Analyse nach den Lehren von Milton Friedman
Marc Chandler writes March 2025 Monthly
| The CRB index has been trending lower since late May. It fell nearly 10% to retrace 50% of the rally come June 2017. This Great Graphic shows the 4 1/2 month trendline. It had been violated in late August but fell back under it at the end of last week.
On Monday, it gapped higher, above the trendline. Today it filled the gap and rallied to new session highs. A move above 192.00 would likely confirm a bottom of some importance is in place. The technical readings on the weekly bar charts are more constructive than the dailies. The commodities in the basket are mostly traded in US dollars. Typically, then when the dollar is strong, one generally expects lower commodity prices and vice versa. On a purely directional basis, the CRB Index and the Dollar Index have an inverse correlation of -0.65 over the past 60 days. Since 2016, the inverse correlation has rarely been stronger. This would suggest that the next move may have a weaker inverse correlation. That is to say that a favorable near-term technical outlook for the CRB Index may not have significant implications for the Dollar Index, even if there is a small negative bias. |
CRB index, lower since late May |
Tags: #USD,DXY,Featured,Great Graphic,newsletter

